You have an array of 65,536 numbers, each between 0 and 255, and a loop that adds up the ones that are at least 128. You time it and get a little under 3 nanoseconds per number. Then you sort the array, change nothing else in the program, and time it again. Now it takes about half a nanosecond per number, four to five times faster, for the same loop over the same numbers doing the same additions.
Nothing in the source code explains that. The loop does identical work either way, so the difference has to come from something you don't normally look at: the processor running it. The compiler turns every program you write into instructions, tiny steps such as "load this number from memory" or "add these two numbers", and the part of the processor that carries them out is called a core. It's natural to picture a core doing your instructions one at a time, finishing each before it begins the next. A real core works on many at once, guesses what your program is about to do before the program has decided, and throws work away whenever a guess turns out wrong. The sorted array changes how often those guesses are right.
This chapter asks one question: why does the same loop run at such different speeds, and what can you do about it? We'll start by timing a core to learn what a tick of its clock is, then build up how a core is organised one problem at a time, watching each idea change the speed of this one loop. Along the way a second surprise turns up: splitting one running total into four, a change that leaves the arithmetic the same, makes a loop about four times faster.
01How fast is one core?
1.1A billion additions
Before looking inside a core, let's find out how fast one is, using nothing but a stopwatch. The program below adds 1 to a variable a billion times and reports how long that took. Each addition uses the result of the previous one, so no addition can start until the one before it has finished. The odd-looking __asm__ line produces no instruction at all. It tells the compiler "this variable may be changed by something you can't see", and that stops the compiler from noticing that the loop always ends with a billion and replacing the whole loop with that answer (section 5 shows how easily that happens). Timings are in nanoseconds, billionths of a second.
You need a C compiler (clang or gcc). Save the code as clock.c, then compile and run it with clang -O2 clock.c -o clock && ./clock. The -O2 flag asks the compiler to optimise, which is how real programs are built.
#include <stdio.h>
#include <time.h>

static double now(void) {
    struct timespec t; clock_gettime(CLOCK_MONOTONIC, &t);
    return t.tv_sec + t.tv_nsec * 1e-9;
}

int main(void) {
    long n = 1000000000L, x = 0;
    double t0 = now();
    for (long i = 0; i < n; i++) {
        x += 1;
        __asm__ volatile("" : "+r"(x));   // stop the compiler folding the loop away
    }
    double s = now() - t0;
    printf("%ld dependent adds: %.0f ms  ->  %.2f ns each  ->  ~%.1f GHz if one add per cycle\n",
           x, s * 1000, s / n * 1e9, n / s / 1e9);
}1000000000 dependent adds: 225 ms -> 0.22 ns each -> ~4.4 GHz if one add per cycleA billion additions took about a quarter of a second. Run it a few times and the time will wobble (225, 227 and 256 ms in three runs of this program), because a core changes its own clock speed with load and temperature.
1.2What the number means
A core is driven by a clock that ticks at a steady rate, and every step it takes lasts a whole number of ticks. One tick is a clock cycle, and the rate is measured in gigahertz (GHz), billions of cycles per second. Because each addition in our loop has to wait for the previous one, the loop can run no faster than one addition per cycle. At 0.22 ns per addition the cycle is about 0.22 ns long, which means the core ticks about 4.4 billion times a second, and it performs over four billion of these additions every second.
From here on we'll count time in cycles wherever we can, because a cycle count stays the same when the clock speed changes. A core running at 3 GHz and one running at 4 GHz take the same number of cycles for the same instruction. Only the nanoseconds differ.
Now notice a puzzle. An instruction has more to do than add two numbers. The core has to fetch the instruction from memory, work out what it is asking for, do it, and store the result. Even if each of those four jobs took only one cycle, a core that finished one instruction completely before starting the next would need four cycles per addition. Our timing showed one cycle per addition, so the core must already be working on the next instruction while it finishes the last one. How can it do that?
02Overlapping instructions: the pipeline
2.1One instruction at a time
To see how a core can finish an instruction every cycle, start with the simplest processor you could build, one that does all the work for an instruction before it looks at the next. Think of a laundromat with a washer, a dryer and a folding table, where you do one load at a time: wash it, dry it, fold it, and only then start the next. Each machine stands idle two thirds of the time. The simple processor works the same way, with four jobs that each get their own circuitry:
- Fetch reads the next instruction from memory.
- Decode works out what the instruction asks for: an add or a load, and on which numbers.
- Execute does it, using an adder, a multiplier, or a load unit that reads memory.
- Write back stores the result in a register, one of the few dozen tiny storage slots inside the core that hold the numbers it is working on right now.
Run those one instruction at a time and three of the four circuits are idle in every cycle. It's easy to reason about and wasteful, for the same reason that the laundromat is.
2.2The pipeline
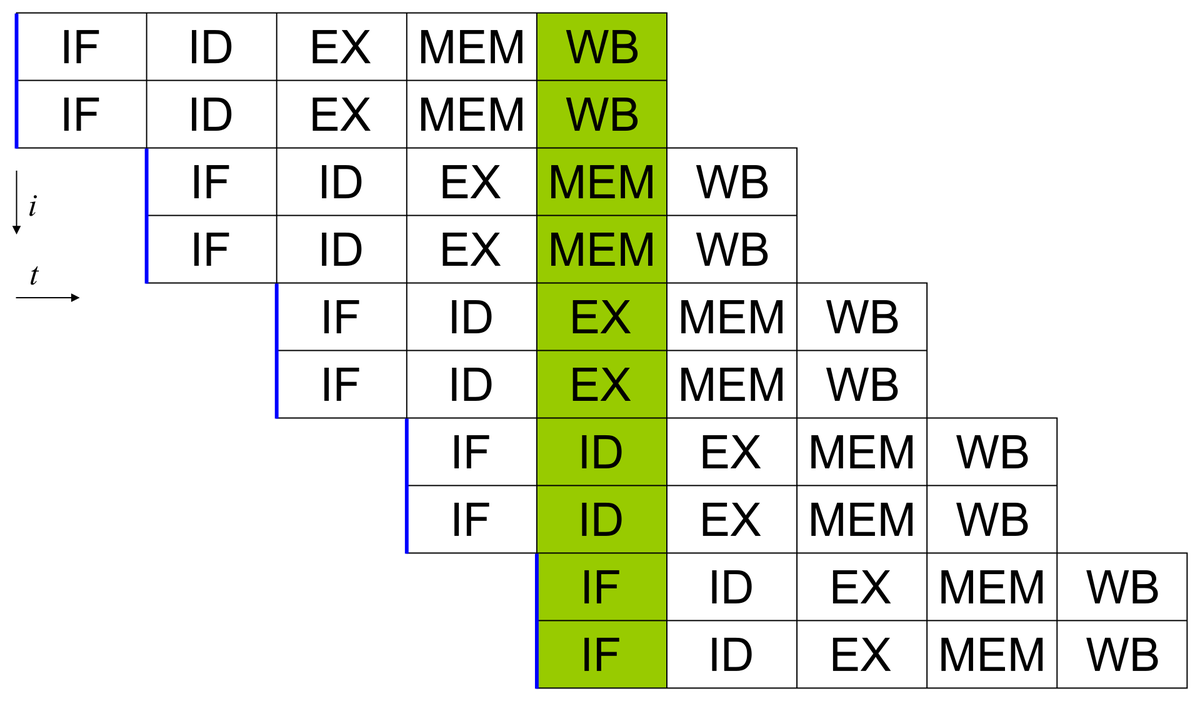
The fix is the one you'd use at the laundromat: put load two in the washer the moment load one moves to the dryer. A core does the same with instructions. While one instruction is being executed, the next is being decoded and the one after that is being fetched. This arrangement is called a pipeline, and each of the jobs is a stage.
Let's watch it on our running loop. To keep the picture simple, first take the if out of the loop, so it just loads each number and adds it to sum. That gives a stream of instructions: load v[0], add it to the sum, load v[1], add it, and so on. The scene follows the first four through the four stages.
load v[0], from memory. The other three stages have nothing to work on yet.Look at cycle 4, where all four stages are working at once. The very first instruction needed four cycles to get through, but after that the core finishes one every cycle, even though each individual instruction still takes four. This is the first half of how the loop in section 1 managed one addition per cycle: its additions were being fetched, decoded and executed in overlap. Real cores cut the work into more and smaller stages than four, but the idea is the same.
You may have spotted a snag in cycle 4. Instruction 2 adds v[0] to the sum, but instruction 1 is only now writing v[0] into its register. Real pipelines handle this by passing a result straight from the end of one instruction's execute stage into the next instruction's execute stage, without waiting for write back. That shortcut is called forwarding, and with it the add gets its number just in time.
There's one more thing the picture leaves out. Each pass of the loop in section 1 holds three instructions: the add, a step that counts down how many passes are left, and a jump back to the top. So the core was in fact finishing about three instructions per cycle there, which a single pipeline can't do. Section 4 explains how it manages that.
A pipeline has four stages, and every instruction takes one cycle in each stage. If a program has 100 instructions that don't depend on each other, roughly how many cycles does the core need to finish all of them?
?Why don't designers just add more and more stages?
More stages do help up to a point. With more stages, each one has less to do, so each cycle can be shorter and the clock can tick faster, and that's why real pipelines have well over four. But a deeper pipeline also holds more half-finished instructions at any moment. The next section shows a situation where the core discovers it has been fetching the wrong instructions and must discard every one of them, and the deeper the pipeline, the more work that throws away. Designers stop adding stages where that loss starts to outweigh the faster clock.
Everything in the scene assumed that the instruction to fetch next is the one after the last. Put the if back into our loop and that stops being true.
03Branches, and guessing which way they go
3.1The problem with if
Our loop is if (v[i] >= 128) sum += v[i]. In instructions, that becomes a compare of v[i] with 128, followed by a branch: an instruction that chooses which instruction comes next. One choice runs the body of the if (the add), and the other skips it.
Here is the difficulty. The core has to fetch the instruction after the branch while the branch itself is still working its way down the pipeline, and the comparison it depends on won't be finished for several cycles. At that moment the core doesn't know which instruction comes next. It has two options. It can wait until the comparison is done, but then the front of the pipeline sits idle on every if, and since most programs have a branch every few instructions, that throws away most of what the pipeline bought. Or it can guess.
Every modern core guesses. A circuit called the branch predictor remembers which way each branch went recently and predicts the next outcome from that. The core fetches instructions down the predicted path and starts executing them without waiting, which is called speculative execution: the results are held back and only made permanent once the branch is known to have gone the predicted way. If the guess was right, nothing was lost. If it was wrong, everything fetched down the wrong path has to be thrown away. Here is one wrong guess on our loop, at v[7] = 57:
if (v[i] >= 128) with v[7] = 57. The core must fetch the next instruction now, but the comparison hasn't finished. The predictor looks at its history: the last three times, the body of the if ran.Predictors are very good, comfortably over 95% right on ordinary code. That is exactly why the misses are expensive enough to see: the core is built to run far ahead of what it has finished, and a miss throws all of that away.
3.2The data decides the guess
What decides whether the guess is right? The data. Think about what the branch in our loop sees. Over sorted numbers it sees a long run of "skip", then a long run of "run the body", and it changes its mind exactly once. Over shuffled numbers it sees an unpredictable mixture, and no rule about the past can do better than a coin flip. To see the effect, here is the crudest possible predictor, which guesses that the branch will do whatever it did last time, applied to eight values. (Real predictors look at longer patterns, but this one is enough to show why runs matter.)
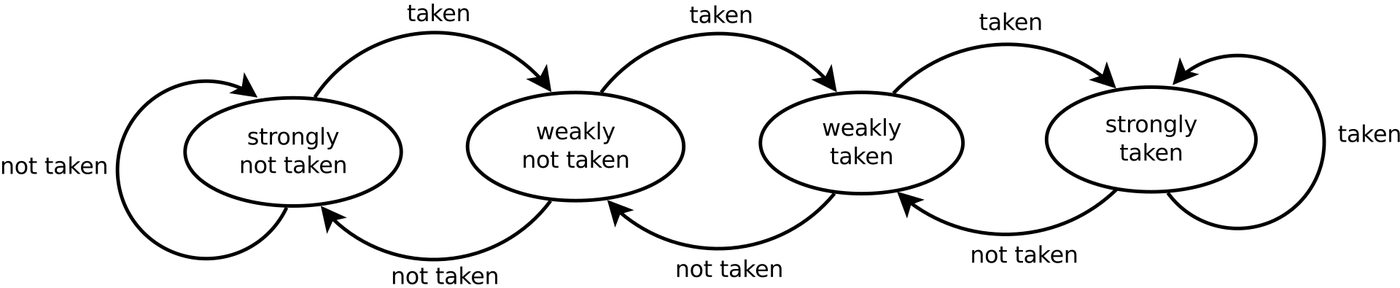
One step up from "same as last time" is to keep a small counter for each branch, so that a single surprise doesn't flip the guess.
Now the real loop. The version below adds each value that is at least 128 to a running sum, over 65,536 random values, 60 times over. The body of the if is a call to a tiny function, add_big, which the compiler is told never to inline, meaning it must keep the call as a call and never paste the function's body into the loop. That guarantees the loop contains a real branch for the core to guess at. Section 5 shows what happens without it.
Now sort the vector first and change nothing else: same instructions, same number of elements, same number of calls to add_big(). What happens to the time per element?
#include <algorithm>
#include <chrono>
#include <cstdio>
#include <random>
#include <vector>

// noinline: the compiler must keep a real call here, so it must keep a real branch
// in front of it (section 5 shows what happens without it)
__attribute__((noinline)) long add_big(long sum, int x) { return sum + x; }

static double ns_per_element(const std::vector<int>& v, long& result) {
    long sum = 0;
    auto t0 = std::chrono::steady_clock::now();
    for (int pass = 0; pass < 60; pass++)
        for (size_t i = 0; i < v.size(); i++)
            if (v[i] >= 128) sum = add_big(sum, v[i]);
    auto t1 = std::chrono::steady_clock::now();
    result = sum;
    return std::chrono::duration<double, std::nano>(t1 - t0).count() / (v.size() * 60.0);
}

int main() {
    std::mt19937 rng(42);
    std::vector<int> v(65536);
    for (auto& x : v) x = rng() % 256;

    long r1, r2;
    double shuffled = ns_per_element(v, r1);
    std::sort(v.begin(), v.end());
    double sorted = ns_per_element(v, r2);

    printf("shuffled: %.3f ns per element\n", shuffled);
    printf("sorted:   %.3f ns per element\n", sorted);
    printf("sorted is %.1fx faster   (same sum both times: %s)\n",
           shuffled / sorted, r1 == r2 ? "yes" : "NO");
}shuffled: 2.437 ns per element
sorted: 0.647 ns per element
sorted is 3.8x faster (same sum both times: yes)Save it as branch.cpp and build it with clang++ -std=c++20 -O2 branch.cpp -o branch. The program times the loop twice, once over the shuffled values and once after std::sort has put the same values in order, and every number it prints is nanoseconds per element, so smaller is faster. Notice three things in the output. The sums match, so both runs did the same work. The sorted run is several times faster. And the absolute times move from run to run with the core's clock speed, while the ratio stays in a narrow band: this program gives somewhere between 3.5 and 4.5 times, and the measurements in the cost tables later in this chapter gave 4.9.
?Why does a wrong guess cost 10 to 20 cycles?
Because that's how much work was in flight behind the branch, and all of it has to be discarded and fetched again. We can work the cost out from the two timings. In the measurements used in this chapter's tables, the shuffled loop costs about 2.2 ns more per element than the sorted one. On random data only about half the branches are guessed wrong, so those 2.2 ns are spread over half a wrong guess per element, which puts each wrong guess at about 4.3 ns, roughly 17 cycles at 4 GHz. The run shown above works out the same way to about 3.6 ns, at whatever clock speed the core was running then. Across modern cores, 10 to 20 cycles is the usual range. Whatever the exact figure, it's the price of refilling the front of a pipeline that a wrong guess just emptied, so it grows with how deep the pipeline is.
3.3The security cost of guessing
Running ahead on a guess has a cost beyond speed. When the core discards the work done down a wrong path, it restores everything the program can see: its registers and its memory. Hardware designers call that visible part the architectural state. What the core doesn't restore are side effects in its hidden inner workings, which designers call the microarchitectural state and which the program isn't supposed to be able to see. The main one is the contents of the cache, a small, fast memory next to the core that holds recently used data (chapter 02 is about it). A wrong-path instruction that touched some data leaves that data in the cache, and another program can later notice, by timing its own reads, which data is there.
That gap is what the Spectre and Meltdown attacks exploited when they became public in 2018. The fixes for them are called mitigations, and the mitigations cost real time. Most of it is paid on every system call (syscall for short), which is the moment a program asks the kernel, the privileged core of the operating system, to do something for it, such as reading a file. The mitigations add work at each of those crossings so that guesses made on one side can't leak what's on the other.
So guessing makes the core fast and leaves a security hole that costs speed to close. It also does something else that matters for the rest of this chapter. When the guesses are right, the core can keep fetching far beyond the instructions it has finished, so it always holds many instructions at once that it hasn't completed yet. If some of them have nothing to do with each other, there is no reason to run them one at a time.
04Running independent work side by side
4.1Dependency chains and latency
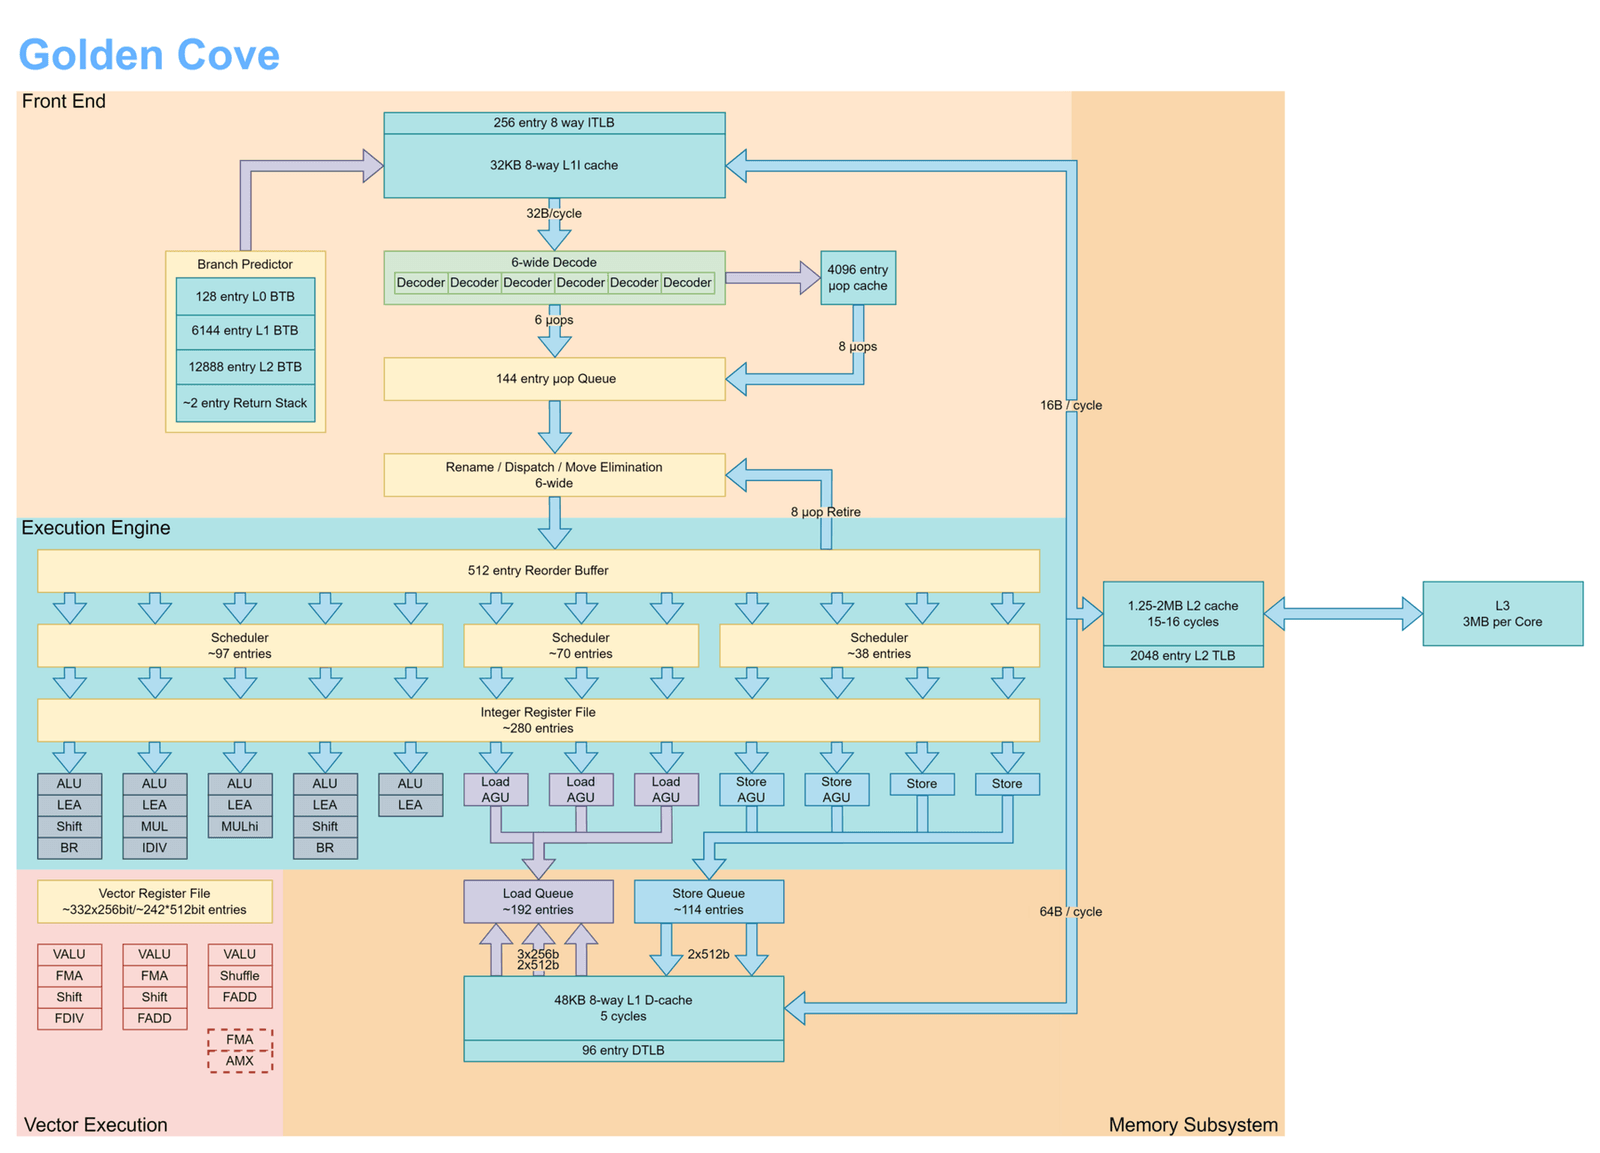
A single pipeline finishes at most one instruction per cycle, however many it holds, yet the loop in section 1 finished about three. So designers built several pipelines side by side. A modern core is superscalar: it decodes and starts several instructions every cycle, with several units for whole-number arithmetic, several for loading and storing memory, and others that work on several numbers at once. The widest recent cores can handle roughly six to eight instructions per cycle.
It also helps if the core is willing to reorder work. An instruction that is still waiting for a number it needs shouldn't hold up later instructions that are ready to go. So the core keeps waiting instructions in a holding area called the scheduler, starts whichever ones have all their inputs, in whatever order that turns out to be, and retires them (makes their results final) in the order you wrote them, so the program can never tell. A core that does this is called out-of-order.
All of that only works when instructions don't depend on each other. Look at the sum in our loop. Each sum += ... needs the previous value of sum, so no amount of hardware can start the second addition before the first has finished. A sequence of operations where each needs the previous result is a dependency chain. For additions this costs nothing we'd notice, since an addition takes one cycle and the pipeline delivers one per cycle anyway, which is exactly what section 1 measured.
To make the effect visible, make each step more expensive. Replace the add with a multiply-add, a = a*K + C for two constants K and C, which the compiler turns into a single multiply-add instruction on ARM. That's the shape of a simple random number generator:
for (long i = 0; i < N; i++)
    a = a * K + C;                    // about 0.96 ns per step
Each step still needs the previous a, so this is another dependency chain, but a longer one. The time one step takes from start to result is its latency, and for this multiply-add it is about four cycles: 0.96 ns on a core running at about 4 GHz. While one step is in flight, the core has nothing else to do with its multiplier, and most of the machine sits idle.
?What's the difference between latency and throughput?
Latency is the time from starting one operation to getting its result. Throughput is how many operations of that kind the core can start per cycle. A multiply-add with four cycles of latency can still have a throughput of one per cycle, because the multiply circuit is itself a small pipeline. That means four multiplies can be in flight at once, provided none of them waits on another. In a single chain you pay the latency every step, and you never get to use the throughput.
4.2Four chains instead of one
So split the work into several independent chains, each with its own variable:
for (long i = 0; i < N; i += 4) {
    a = a*K+C;  b = b*K+C;            // about 0.23 ns per multiply-add
    c = c*K+C;  d = d*K+C;            // same number of multiply-adds overall
}
The final value is different (four short chains instead of one long one), but the amount of arithmetic is the same. The scene below compares one chain with four over the first eight cycles. It draws a single multiply unit that can start one multiply-add per cycle and takes four cycles to finish each. Here a1 is the first step of chain a, a2 is the second, and so on.
a1 starts. Step a2 needs the result of a1, and a3 needs a2, so both sit in the scheduler. The multiply unit could start a new multiply-add every cycle, but nothing else is ready.In the measurements behind this chapter's tables, four chains cost about 0.23 ns per multiply-add, against about 0.96 ns for one chain: 4.2 times faster. Eight chains reach about 0.13 ns, 7.5 times faster for the same arithmetic. The picture draws one multiply unit and stops at four chains, but a real core has more than one multiply unit, so eight chains still help. Section 6 plots the whole curve.
Here is a program you can run to see the same shape. It runs the multiply-add loop with 1, 2, 4 and 8 chains and reports the time per multiply-add for each. The starting value comes from argc, which the compiler can't know ahead of time, and the final values are printed, so the compiler can neither precompute the chains nor discard them.
#include <stdio.h>
#include <time.h>

#define N 200000000L
#define K 6364136223846793005L
#define C 1442695040888963407L

static double now(void) {
    struct timespec t; clock_gettime(CLOCK_MONOTONIC, &t);
    return t.tv_sec + t.tv_nsec * 1e-9;
}

static double one(long seed, long *out) {
    long a = seed;
    double t0 = now();
    for (long i = 0; i < N; i += 1) { a = a*K + C; }
    double s = now() - t0;
    *out = a;
    return s / N * 1e9;
}

static double two(long seed, long *out) {
    long a = seed, b = seed + 1;
    double t0 = now();
    for (long i = 0; i < N; i += 2) { a = a*K + C; b = b*K + C; }
    double s = now() - t0;
    *out = a ^ b;
    return s / N * 1e9;
}

static double four(long seed, long *out) {
    long a = seed, b = seed + 1, c = seed + 2, d = seed + 3;
    double t0 = now();
    for (long i = 0; i < N; i += 4) { a = a*K + C; b = b*K + C; c = c*K + C; d = d*K + C; }
    double s = now() - t0;
    *out = a ^ b ^ c ^ d;
    return s / N * 1e9;
}

static double eight(long seed, long *out) {
    long a = seed, b = seed + 1, c = seed + 2, d = seed + 3;
    long e = seed + 4, f = seed + 5, g = seed + 6, h = seed + 7;
    double t0 = now();
    for (long i = 0; i < N; i += 8) {
        a = a*K + C; b = b*K + C; c = c*K + C; d = d*K + C;
        e = e*K + C; f = f*K + C; g = g*K + C; h = h*K + C;
    }
    double s = now() - t0;
    *out = a ^ b ^ c ^ d ^ e ^ f ^ g ^ h;
    return s / N * 1e9;
}

int main(int argc, char **argv) {
    (void)argv;
    long seed = argc, sink = 0, o;          // argc is 1, but the compiler can't know that
    double t1 = one(seed, &o);   sink ^= o;
    double t2 = two(seed, &o);   sink ^= o;
    double t4 = four(seed, &o);  sink ^= o;
    double t8 = eight(seed, &o); sink ^= o;
    printf("chains  ns per multiply-add  speedup\n");
    printf("%6d  %19.3f  %6.1fx\n", 1, t1, t1 / t1);
    printf("%6d  %19.3f  %6.1fx\n", 2, t2, t1 / t2);
    printf("%6d  %19.3f  %6.1fx\n", 4, t4, t1 / t4);
    printf("%6d  %19.3f  %6.1fx\n", 8, t8, t1 / t8);
    printf("(checksum %ld)\n", sink);
}chains ns per multiply-add speedup
1 1.294 1.0x
2 0.651 2.0x
4 0.326 4.0x
8 0.174 7.4x
(checksum 4996457530428425742)Compile it with clang -O2 chains.c -o chains. Read the speedup column: the two-chain loop is about twice as fast as the one-chain loop, four chains about four times, and eight chains a little under eight times. The absolute times depend on the clock speed at the moment you run it, but the speedups barely move. The checksum at the end is there only so the compiler has to compute the results.
?So was it the unrolling that made it faster?
No. The loop above is unrolled: each pass through it does four steps' worth of work. Unrolling by itself saves only a little loop bookkeeping, such as counting and jumping back to the top. What helped is the four independent dependency chains that the unrolling made room for. If you unroll a loop four ways but keep a single variable that every step updates (a single accumulator), each step still waits for the one before, and the chain is exactly as long as it was.
We now have two effects that each change a loop's speed severalfold, and both are surprisingly easy to measure wrongly, because the compiler is also trying to make your code fast.
05When the compiler removes what you're measuring
5.1A branch penalty of exactly 1.0×
The two programs above are written in a particular way for a reason: the obvious versions of both measure nothing. Start with the branch. The obvious loop is if (d[i] >= 128) sum += d[i], with the add written directly in the loop and no function call. Timed over sorted and shuffled data, it reports a penalty of exactly 1.0×, with no difference at all. To find out why, we have to look at the assembly the compiler produced: the machine instructions, written out as readable text.
    cmp   w10, #0x7f
    csel  w10, w10, wzr, gt     ; conditional select — NO BRANCH EXISTS
    add   x0, x0, x10           ; add unconditionally
The first line compares the number with 127 (0x7f is 127 in hexadecimal, and greater than 127 is the same as at least 128). The second, csel, is a conditional select: it picks the number if the comparison said "greater" and picks zero otherwise. The third adds whatever was picked, always. There is no branch anywhere in these three lines. The compiler removed the if and replaced it with arithmetic, so there's nothing to guess and nothing to mispredict, and sorting the data can't change anything.
?When does the compiler do this?
Whenever both sides of the if are cheap. The transformation is called if-conversion: computing both outcomes and picking one is faster than risking a misprediction. On x86 the instruction is called cmov instead of csel. It's a good optimisation, and it silently destroys any branch-prediction experiment.
It's also why a famous puzzle has aged. For years the top-voted question on Stack Overflow was about a 6× gap between sorted and shuffled input to identical code. On many modern targets the compiler now removes the branch and the effect disappears. The answers are still worth reading, but check whether your compiler still emits a branch at all.
You can check for yourself. The command below writes the loop into a file, asks the compiler for assembly (-S) instead of a program, prints it to the screen (-o -), and keeps only the lines that mention a comparison, a load (ldr) or a conditional select. The -fno-vectorize flag turns off one further optimisation: without it, clang on a laptop core goes a step beyond csel and handles many numbers per instruction with comparison masks, which also contains no branch. On x86, look for cmov instead of csel.
cat > sum_big.c <<'EOF'
long sum_big(const int *v, int n) {
    long sum = 0;
    for (int i = 0; i < n; i++)
        if (v[i] >= 128) sum += v[i];
    return sum;
}
EOF
clang -O2 -fno-vectorize -S sum_big.c -o - | grep -E 'csel|cmp|ldr' cmp w1, #1
ldr w10, [x0], #4
cmp w10, #127
csel w10, w10, wzr, gtThe names like w10 are registers. Reading from the top: the first cmp checks that the array isn't empty (n against 1), ldr loads the next v[i], the second cmp compares it with 127, and csel selects. The loop body has one comparison and one select and no branch other than the jump back to the top that every loop has, which the grep filtered out.
5.2Zero nanoseconds per add
The second trap catches the chain benchmark. Written the obvious way, with the loop body a += i, it reports 0.000 ns per add. Adding up 0, 1, 2 and so on has a closed-form answer, a single formula (n(n-1)/2) that gives the total without any loop, so the optimiser replaces the whole loop with a formula computed once, and nothing is left to time. The same thing happens to any timed loop whose result is never used: the compiler can delete it entirely, so the programs in this chapter print the sums and checksums they compute.
That's why the two programs in this chapter look the way they do. The branch program forces a real branch with the noinline call. The chain program uses a multiply-add, which has no shortcut formula the compiler knows, starts from a value the compiler can't see, and prints its result.
With the traps avoided, the numbers mean what they say. Let's put them side by side.
06What it costs
6.1The price of a wrong guess
These numbers come from the loops in sections 3 and 4, compiled with clang -O2 and taken as the median of five runs on a laptop core. They move with the core's clock speed from run to run, so treat the ratios as the stable part.
Seventeen cycles is roughly the length of the pipeline as seen from outside. Expect somewhere between 10 and 20 cycles on other modern cores.
To feel the size of that, take a loop over a hundred million elements. Shuffled, it spends about 0.27 seconds where sorted data takes about 0.06:
| Elements | target | 100 million |
| Shuffled, 2.724 ns each | 100,000,000 × 2.724 ns | 272 ms |
| Sorted, 0.556 ns each | 100,000,000 × 0.556 ns | 56 ms |
| time saved by sorting first, for the same additions | ≈ 217 ms (4.9×) | |
Sorting has its own cost, so sorting just to make one pass faster rarely pays. It pays when you read the same sorted data many times, or when the data comes out sorted anyway.
6.2How much overlap is available
Here is the same arithmetic spread over 1, 2, 4 and 8 chains, from the measurements behind this chapter. Look at how the time per multiply-add halves each time the number of chains doubles.
| Chains | ns/op | Speedup | What limits it |
|---|---|---|---|
| 1 | 0.959 | 1.0× | Multiply latency. The core waits. |
| 2 | 0.456 | 2.1× | Two in flight. |
| 4 | 0.228 | 4.2× | Four in flight. |
| 8 | 0.128 | 7.5× | Multiplier throughput. The core is nearly full. |
A loop of a hundred million multiply-adds takes about 96 ms as one chain and about 13 ms as eight, the same arithmetic 7.5 times faster.
?How can one multiply-add take less than a cycle?
At 4 GHz, 0.128 ns is roughly half a cycle per multiply-add. So the core is completing about two per cycle, which is only possible with at least two multiply units running at once. That also tells you how many chains you need. Each multiply-add takes about four cycles, and the core can start about two per cycle, so it needs about eight in flight to keep both units busy. Eight chains is about where the curve has to level off, and more chains than that can't help. How many of one kind of operation a core can start per cycle is its issue width for that operation, and a curve like this one is how you find it without a datasheet.
So the hardware offers a several-fold speed-up, but your code only gets it if it's arranged to use it. The last section is about what that means in practice.
07What you can change, and what to do about it
7.1Measuring where a loop is stuck
Each question the chapter raised has a tool that answers it on a running program. The first one needs a new word: IPC, instructions per cycle, the average number of instructions the core finishes each cycle. A wide modern core can reach six to eight at best, and real code often runs at one or two. Low IPC means the core is waiting, and the other counters tell you what for. These are Linux commands; perf reads the hardware counters built into the core, which count events such as cycles, instructions and branch misses.
# Is the core busy or waiting? (section 4: IPC is instructions divided by cycles)
perf stat -e instructions,cycles ./app

# Is it waiting on wrong guesses? (section 3)
perf stat -e branch-misses ./bench

# Did the compiler keep my branch, or turn it into csel? (section 5; use cmov on x86)
objdump -d ./bench | grep csel
On a Mac, perf doesn't exist, but the clang -S command from section 5 answers the third question.
7.2Rules that hold up
These are ranked by how often they pay off in practice.
- Check IPC before anything else. It tells you whether to look at memory, at branches or at dependency chains.
- Break dependency chains. Give a sum or any other running total several accumulators and combine them at the end, and arrange the work so consecutive operations don't feed each other. Up to 7.5 times is sitting in the measurement above.
- Make branches predictable, or remove them. Sort or partition the data so a batch takes the same path. Where both bodies are cheap, write it without a branch and let the compiler emit a
csel. - Read the disassembly before concluding anything. Section 5 is the reason.
7.3What you control, and what each fix costs
Five things decide how these effects hit your code. Only some of them are yours.
| Variable | Effect | Can you reach it? |
|---|---|---|
| Predictability of your data | Decides the mispredict rate entirely | Yes: sort, partition, or batch by type |
| Whether a branch exists at all | If-conversion removes the question | Indirectly, by keeping both sides cheap |
| Dependency chain length | Latency-bound versus throughput-bound | Yes: unroll, use multiple accumulators |
| Pipeline depth | Sets the misprediction penalty | No. It's the silicon. |
| Issue width | Caps how much overlap helps | No, but you can find it by measuring |
Data predictability and dependency structure are the two you can act on. Both are properties of how you arranged your code and data, and neither changes what the code computes. Each fix has a price:
| You get | You pay | When the bill arrives |
|---|---|---|
| Predictable branches from sorting | The cost of the sort itself | When the data is only read once |
| No mispredicts from branch-free code | Both sides of the if run every time | When the branch was predictable already, so the work was wasted |
| Several chains from several accumulators | More registers and more code | In floating-point sums, where the order of additions changes and the last digits can differ |
7.4Symptom, cause, fix
| Symptom | Likely cause | Fix |
|---|---|---|
| Low IPC, high cache misses | Waiting on memory | Chapter 02; nothing in this chapter will help |
| Low IPC, clean cache counters, high branch misses | Unpredictable branches | Sort or partition the data, or go branchless |
| Low IPC, clean cache and branch counters | A long dependency chain | Multiple accumulators, independent chains |
| Adding a branch made nothing slower | The compiler if-converted it | Check for csel / cmov in the disassembly |
| A benchmark reports ~0 ns | The loop was folded to a constant | Inputs the compiler can't see; use the result; read the assembly |
08Summary
- A core finishes about one instruction per cycle even though each takes several, because a pipeline overlaps fetch, decode, execute and write back (section 2).
- Branches break the pipeline, so the core guesses. A branch predictor picks a path and the core runs down it speculatively (section 3.1).
- A wrong guess costs a pipeline flush. About 17 cycles at 4 GHz in the measurements here, 4.3 ns per mispredict, and 10 to 20 cycles on modern cores generally.
- The data decides the mispredict rate. Sorted input ran at 0.556 ns per element, and the same input shuffled ran at 2.724 ns, because sorted data changes direction once and shuffled data changes constantly.
- Speculation has a security cost. Spectre reads the cache traces it leaves, and the mitigations slow every system call.
- A core runs many instructions at once, if they're independent. One dependency chain pays latency, and several chains pay throughput.
- Independent chains, not unrolling, give the speedup. Eight chains made the same multiply-adds 7.5 times faster.
- Compilers remove what you're trying to measure. If-conversion deletes branches and folding deletes loops.
- Check IPC first. It tells you whether to look at memory, branches or dependency chains.
- Only two of the five variables are yours. Data predictability and dependency structure. Pipeline depth and issue width belong to the silicon.
09Build this
Start by getting it wrong, because watching the obvious benchmark fail teaches the most.
- Write the sorted-versus-shuffled benchmark the naive way:
if (x >= 128) sum += x. You'll measure a penalty near 1.0×. - Disassemble it. Find the
cselon ARM or thecmovon x86. The compiler deleted your experiment before it ran. - Force a real branch with a
noinlinecall, as in section 3, and measure again. Expect roughly 3 to 6 times, depending on your core's pipeline depth. - Then extend the chain program from section 4 to 16 chains and find where your curve goes flat. The time per operation on the flat part tells you how many of that operation your core can start per cycle, its issue width for that operation. The number of chains where it flattens is roughly the latency in cycles times that issue width. Neither figure appears in any spec sheet in that form. If the curve flattens much earlier than that, something other than the multiply units is limiting the loop, so read the assembly before trusting the number.
10Interview questions
beginnerWhat does 'instructions per cycle' tell you?›
How well the core is being kept busy. A modern core can retire six to eight per cycle at best, and real code often manages one or two. Low IPC means the core is waiting, on memory, on a dependency chain, or on recovering from a bad guess.
It's the first number to check because it tells you which chapter to open. Low IPC with high cache misses is a memory problem, and low IPC with clean cache counters is a control-flow or dependency problem.
intermediateWhy can sorting an array speed up a later loop without changing the loop?›
Branch prediction. A predicate over sorted data goes the same way for long runs, so the predictor is right nearly always. Over shuffled data it's a coin flip, and every wrong guess discards the speculatively fetched work.
On a laptop core the loop runs at about 0.56 ns per element sorted against 2.7 ns shuffled, a factor of about 4.9, which works out to roughly 17 cycles per mispredict. The caveat matters: compilers often if-convert such branches into a conditional select, and then there's no branch and no effect.
intermediateWhat's the difference between latency and throughput for an instruction?›
Latency is the time from starting one operation to getting its result. Throughput is how many can start per cycle. A multiply might have about four cycles of latency and one per cycle of throughput, so four can be in flight simultaneously.
You only reach the throughput number with independent work. A multiply-add loop takes about 0.96 ns per step as a single chain and about 0.13 ns per step across eight independent chains, 7.5 times faster with the same instruction count.
deepYour microbenchmark shows no difference between two implementations. What do you check first?›
The disassembly. By a wide margin the likeliest explanation is that the compiler deleted whatever you were measuring: it folded a loop to a constant, hoisted an invariant load, or if-converted the branch you wanted to mispredict.
The obvious versions of both benchmarks in this chapter fail this way. One branch becomes a csel, and one loop is replaced by a formula, and only the assembly says so. A benchmark you haven't disassembled is a benchmark you haven't run.
deepWhy did Spectre mitigations make syscalls slower?›
Because the fix is to stop sharing speculation state across a privilege boundary. Flushing or partitioning branch predictors on entry, and on some designs unmapping most of the kernel from the user page table, both add work to every transition.
Architectural rollback was always correct. What leaked was microarchitectural state, such as which data sits in the cache, which survives the discard, and preventing that costs real time on a path that used to be nearly free.
11Go deeper
You add a branch and nothing gets slower. Why might that be?›
The compiler if-converted it into a conditional select. No branch exists in
the binary. Look for csel on ARM or cmov on x86.
Unrolling a loop four ways made it 4x faster. Was it the unrolling?›
No. It's the four independent dependency chains you created. Same work, but now the core can overlap it.
Roughly how many cycles does a mispredicted branch cost?›
Around 10 to 20 on a modern core, and about 17 at 4 GHz in the measurements in this chapter. That's the pipeline being refilled.
IPC is 0.4 and branch misses are negligible. Where do you look?›
Memory, so chapter 02. You're stalling on cache misses, not on control flow.
Latency and throughput for every instruction on every x86 microarchitecture, measured by hand over two decades. Nothing else is this thorough.
A framework for attributing stalls to front end, back end, bad speculation
or retiring. perf stat --topdown implements it directly.
Free, and the best modern introduction to hardware counters for people without a hardware background.
The shortest loop between changing source and seeing what the compiler did. Use it before every microbenchmark, per section 5.
12Related chapters
Where low IPC with high cache misses leads: lines, levels and the latency curve from L1 to DRAM. Chapter 02.
What speculation leaks, and what closing it costs on every privilege crossing. Chapter 44.
The same out-of-order core, seen from a second thread. Chapter 03.