You run operations for a ride-hailing app in India. On the wall of the office is a screen with a bar for every city, showing how many rides were requested in each minute: Pune 41, Mumbai 112, Bengaluru 96, the bars shuffling as each minute closes. When the Pune bar suddenly drops to a third of its usual height at 6 pm on a weekday, someone needs to know within a minute or two, because it usually means the app is failing for Pune riders, or a payment provider is down, or the drivers are on strike.
Every time a rider taps Request, their phone sends a small message saying so: which ride, which city, and when. Counting those messages per city per minute sounds like a one-line SQL query. But that query has no table to run against. Ride messages never stop arriving, so there's never a moment when "all the rides" exist to be counted. And they don't arrive in order. A rider in a tunnel taps Request at 09:00:50, and their phone delivers the message 25 seconds later, after rides from 09:01 have already been counted.
A program that computes answers over data that never stops arriving is called a stream processor, and Apache Flink, Kafka Streams, Google Cloud Dataflow and Spark Structured Streaming are the ones you're most likely to meet. This chapter builds the dashboard's counting job one problem at a time, asking one question the whole way: how do you produce a correct count for "Pune, 09:00" when the rides for that minute keep arriving late, out of order, and possibly twice? We'll start with the batch job you'd write first, turn it into a running count, and then deal with time, completeness, state, crashes and duplicates in the order they bite.
01From a nightly job to a running count
1.1Where the rides are
Before anything is counted, the ride messages have to land somewhere. We'll put them in a Kafka topic called rides, exactly as chapter 23 put orders into a topic called orders. Each phone's message becomes one event, a record of something that happened at a moment: r3, Pune, 09:00:40. Kafka appends each event to the end of a partition, gives it an offset, and keeps it for days, so any number of programs can read the same rides at their own pace. If those words are new, chapter 23 builds them from scratch. For this chapter you only need three facts from it: a topic is split into partitions, each partition is an append-only log numbered by offset, and a reader is nothing more than an offset it remembers.
Our dashboard reads from that topic and needs one number per city per minute. Let's look at the two ways to get it.
1.2The batch answer
The first program most teams write is a batch job: a program that runs over a fixed collection of data, produces an answer, and exits. At midnight, it reads every ride from the day, groups them by city and minute, counts them, and writes 1,440 rows per city into a table. It's easy to write, easy to test, and if it has a bug you fix it and run it again over the same input.
Its weakness is the one that matters for the wall screen: the answer for 18:00 appears six hours later. A batch job can only start once its input is complete, and "complete" here means waiting for the day to end.
So we shrink the batch. Run the same job every minute, over everything that has arrived so far. Now the screen updates every minute, and the cost has moved somewhere else. At 18:00 the job counts eighteen hours of rides to produce one new number, and at 18:01 it counts them all again. Its work grows with the size of the history while the useful output stays one row per city.
1.3Keep the answer and update it
The obvious improvement is to stop recounting. Keep a running count per city and minute in memory, and as each ride arrives, add one to the right counter. Now each ride costs a constant amount of work, a lookup and an increment, however long the job has been running. When a minute is over, send its counts to the dashboard and forget them.
That's the whole idea of stream processing: a long-running program that reads events one at a time as they arrive, updates what it remembers, and emits results as it goes. Its input is a stream, a sequence of events with no last element. Such a program is built from operators, small steps that each take events in and send events out: one reads from Kafka, one works out the city and minute, one counts, one writes to the dashboard's database. Connected together, the operators form a dataflow graph, and a stream processor such as Flink runs that graph for weeks without stopping.
A busy app produces far more rides than one machine can count, so each operator runs as several parallel copies, called instances. Our counting operator might run as four instances on four machines. For the counts to come out right, every Pune ride must go to the same instance, or two instances would each hold half of Pune's count. So the stream processor routes each event by a key, here the city name: it hashes the key and picks an instance, exactly as a Kafka producer picks a partition. Flink calls this step keyBy. After it, one instance owns Pune and everything about Pune.
1.4Bounded and unbounded
Now we can say precisely what changed between the two programs. A batch job reads a bounded dataset, one with a beginning and an end. A stream processor reads an unbounded one, which has a beginning and no end. Where the data is stored makes no difference: one rides topic can be read either way: "every ride from yesterday" is bounded, and "every ride from now on" is unbounded.
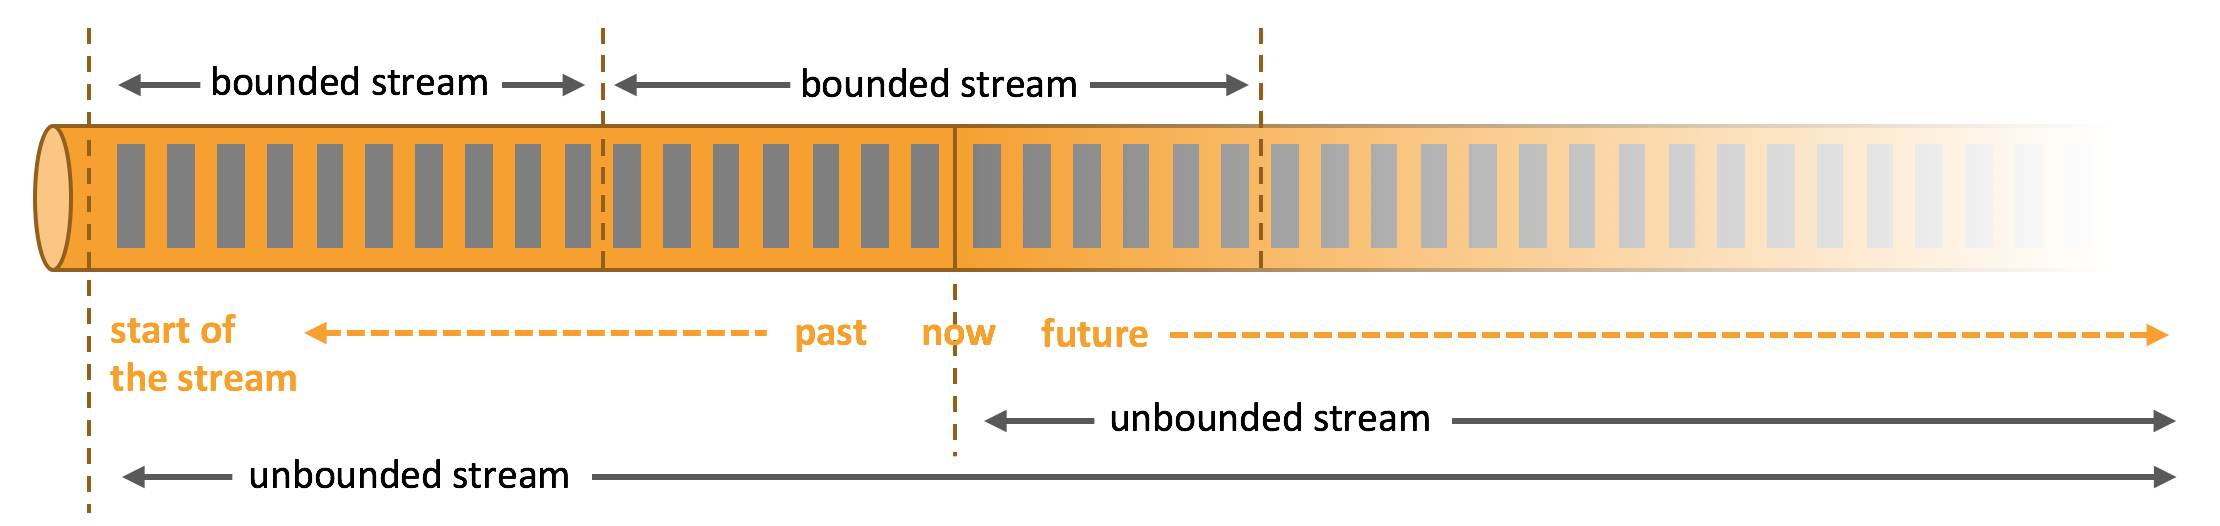
Seen this way, a batch job is a stream job that happens to know where its input ends. Flink runs both with the same engine, and the Dataflow model paper (Akidau et al., VLDB 2015), the design behind Google Cloud Dataflow and Apache Beam, argues for this view directly. Its authors write that we must "live and breathe under the assumption that we will never know if or when we have seen all of our data".
That sentence is the problem the rest of this chapter solves. Our running count adds each ride to "its minute". Which minute is that?
02Which minute does a ride belong to?
2.1Two times on every ride
Every ride has two moments attached to it. One is when the rider tapped Request, which the phone writes into the message. This is the ride's event time: when the thing happened, out in the world. The other is when the counting operator gets the message, read off the clock of the machine running it. This is the ride's processing time.
If the network were instant and nothing ever queued, the two would be equal and we could ignore the difference. They never are. The gap between them for a given event is called skew (the term Akidau's Streaming 101 article uses), and it varies from event to event. A phone with a good signal delivers in a fraction of a second. A phone in a tunnel holds the message until it gets a signal back. A phone with its app in the background may hold a batch of events for minutes. Within the system, an event can wait in a Kafka partition behind a consumer that's catching up after a restart.
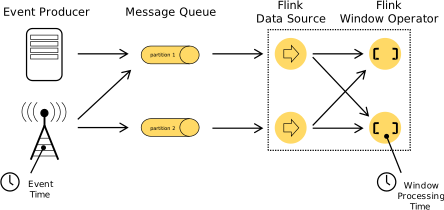
The dashboard wants to know how many rides were requested in Pune between 09:00 and 09:01. That's a question about event time. Counting by processing time answers a different question, "how many Pune ride messages reached our server between 09:00 and 09:01", which is probably the same number on a calm day and wildly different on a bad one.
2.2Counting the same rides both ways
To see how different, here are nine rides with both times written down, in the order they reach the counting operator. t() turns a time like 09:00:55 into seconds, and minute() turns seconds back into the one-minute bucket they fall in. Counter from Python's standard library counts how many times each (city, minute) pair appears. This script counts the rides once by arrival minute and once by event-time minute. Save it as two_clocks.py and run python3 two_clocks.py.
from collections import Counter

def t(s):                      # "09:00:55" -> seconds since 09:00:00
    h, m, sec = map(int, s.split(":")); return (h - 9) * 3600 + m * 60 + sec

def minute(secs):              # the one-minute bucket a time falls in
    return f"09:{secs // 60:02d}"

# (ride, city, event time = when the phone says it happened, arrival = when the processor got it)
rides = [
    ("r1", "Pune",   "09:00:05", "09:00:06"),
    ("r2", "Mumbai", "09:00:20", "09:00:21"),
    ("r3", "Pune",   "09:00:40", "09:00:41"),
    ("r4", "Pune",   "09:00:55", "09:01:02"),
    ("r5", "Mumbai", "09:01:10", "09:01:11"),
    ("r6", "Pune",   "09:00:50", "09:01:15"),   # phone was in a tunnel
    ("r7", "Pune",   "09:01:30", "09:01:31"),
    ("r8", "Pune",   "09:01:45", "09:01:46"),
    ("r9", "Pune",   "09:00:58", "09:01:50"),   # a very slow network
]

by_arrival = Counter((city, minute(t(arr))) for _, city, ev, arr in rides)
by_event   = Counter((city, minute(t(ev)))  for _, city, ev, arr in rides)

print("city    minute  by arrival  by event time")
for key in sorted(set(by_arrival) | set(by_event)):
print(f"{key[0]:<7} {key[1]} {by_arrival[key]:>10} {by_event[key]:>13}")city minute by arrival by event time
Mumbai 09:00 1 1
Mumbai 09:01 1 1
Pune 09:00 2 5
Pune 09:01 5 2Mumbai's rides arrived within a second or two, so both columns agree, which is probably what a calm day looks like for most cities. Pune's don't, and the disagreement is total: by arrival, 09:00 had 2 rides and 09:01 had 5, and by event time it's the other way round. Three Pune rides that happened at 09:00 (r4, r6 and r9) crossed into the next minute on their way in. On the dashboard, the processing-time count would show Pune collapsing at 09:00 and surging at 09:01, which is exactly the kind of fake alarm the screen exists to avoid.
So the counter has to use event time. That brings in the hard part, because event time is a promise made by the sender, and the processor learns about it late and in no particular order.
2.3Can we trust the phone's clock?
?Whose clock is event time read from?
The phone's, and chapter 26 explains at length why a clock on one machine disagrees with clocks on others. A phone synchronised over the network is probably within a fraction of a second of true time, but some phones are minutes off, and a few are years off because their owner set the date by hand. For a per-minute dashboard, small errors move a ride into a neighbouring minute now and then, which is tolerable. Wildly wrong timestamps need a rule, and a common one is to replace any event time far from the arrival time with the arrival time, or to send such events to a separate stream for inspection. Chapter 26 covers clocks themselves; here we take each event's time as given and deal with the fact that events arrive out of order.
With every ride carrying its own event time, the counter can put each one into the right minute. Next we need to decide what "the right minute" should mean in general, because a minute is only one way to slice time.
03Slicing time into windows
A bucket of event time that the counter collects events into is called a window. Our per-minute count uses the simplest kind. There are three in common use, and which one you need depends on the question being asked.
3.1Tumbling windows
A tumbling window cuts time into fixed-size pieces that don't overlap: 09:00 to 09:01, 09:01 to 09:02, and so on. Every event falls into exactly one window, chosen by rounding its event time down to the window size. r6, stamped 09:00:50, rounds down to 09:00 and joins that window, whenever it arrives.
In Flink, tumbling windows are aligned to the Unix epoch (midnight UTC on 1 January 1970) by default, so every one-minute window starts on a whole minute in UTC. Every system does the same rounding: Kafka Streams calls them tumbling windows, Beam calls them fixed windows, and Spark uses window(col, "1 minute").
3.2Sliding windows
The operations team soon asks for a smoother line: "rides in the last five minutes, updated every minute". A one-minute bar jumps around with the luck of the minute, and a five-minute total is steadier. That's a sliding window: windows of a fixed size (five minutes) that start at a fixed interval (every minute), so they overlap. Beam calls the interval the period and calls these sliding windows too, and Kafka Streams calls them hopping windows.
Overlap means one event belongs to several windows. With five-minute windows starting every minute, the ride r6 at 09:00:50 belongs to the windows starting 08:56, 08:57, 08:58, 08:59 and 09:00, all of which cover 09:00:50.
The cost is in that overlap. Each event does size ÷ interval updates, five here, and the operator holds five open windows per key instead of one. A one-hour window sliding every second would mean 3,600 updates per event. Systems that need that shape usually keep one-second tumbling counts and add up the last 3,600 of them when asked, instead of maintaining 3,600 overlapping windows.
3.3Session windows
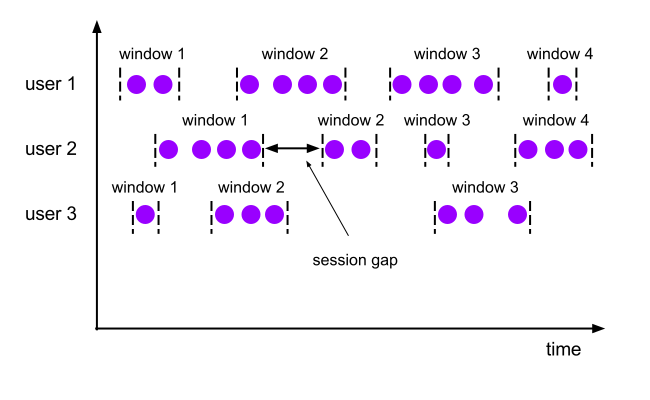
The third kind follows the data instead of the clock. Suppose the product team wants to know how long riders spend in the app before requesting, measured per rider visit. A visit has no fixed length: it's a burst of activity followed by silence. A session window groups one key's events that are close together and closes after a stretch of inactivity, called the gap. With a ten-minute gap, a rider's taps at 09:00, 09:03 and 09:07 form one session, and a tap at 09:30 starts a new one.
?Why are session windows harder to compute?
Because a session's boundaries aren't known in advance, and a late event can join two sessions together. If a rider tapped at 09:00 and 09:15, those are two sessions with a ten-minute gap. If a delayed tap stamped 09:08 then arrives, it's within ten minutes of both, and the two sessions become one. So a session operator starts each event as its own tiny window and merges windows whose spans overlap, and it has to be ready to merge sessions it has already reported.
| Window | Shape | Each event belongs to | Typical question |
|---|---|---|---|
| Tumbling | Fixed size, no overlap | Exactly one window | Rides per city per minute |
| Sliding (hopping) | Fixed size, starts every interval | size ÷ interval windows | Rides in the last 5 minutes, every minute |
| Session | Ends after a gap of inactivity, per key | One window, which may merge with others | How long is a rider's visit? |
3.4The question windows don't answer
The dashboard needs one more thing from the counter: it has to send the 09:00 count at some point. With a tumbling window that's easy to say and hard to do. "When the 09:00 window is complete" means "when no more rides stamped between 09:00 and 09:01 will ever arrive", and section 2 showed one arriving 52 seconds late. Nothing in the stream says a minute is finished. How a stream processor decides anyway is the subject of the next section.
04When is a minute finished?
4.1Waiting by the wall clock
The first idea is to wait a fixed time after the minute ends, by the processing clock. Send the 09:00 count at 09:01:30, by the server's clock, on the theory that 30 seconds is enough for stragglers.
That breaks the first time the job falls behind. Suppose the counting job is restarted at 09:05 after a deployment and starts reading the rides topic where it left off, at 09:00. It reads five minutes of rides in a few seconds, and by its clock, 09:01:30 passed long ago for every one of those minutes. So it sends each count as soon as the first ride of the next minute shows up, while most of the minute's rides are still waiting to be read in the topic. This rule ties completeness to the processor's clock, and the processor's clock says nothing about which rides it has seen.
What the counter needs is a measure of progress in event time: a statement about the input itself, travelling with the input.
4.2The watermark
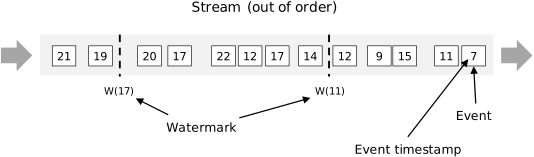
That measure is a watermark: a timestamp carried through the stream that says "no more events with an event time earlier than this are expected". When the counter's watermark reaches 09:01:00, the 09:00 window is declared complete, its count is sent, and its state can be thrown away. A watermark moves only forward, and it moves with the data. If the job is replaying five-minute-old rides, the watermark is five minutes behind too, so the replay produces the same counts as the live run did.
This idea came from Google's MillWheel paper (VLDB 2013), which called it the low watermark, and it's central to the Dataflow model and to Flink, Beam and Spark. Where does the watermark's value come from? For our rides there's no way to know for certain, because any phone could be in a tunnel. So the watermark is an estimate, and a simple one works well: track the largest event time seen so far and subtract a bound on how out of order events usually are. With a bound of 30 seconds, after seeing a ride stamped 09:01:30 the watermark becomes 09:01:00. Flink provides exactly this as WatermarkStrategy.forBoundedOutOfOrderness(Duration.ofSeconds(30)).
A watermark built from what you know about the input, guessing that stragglers won't be later than 30 seconds, is called a heuristic watermark. Some inputs allow a perfect watermark, one that's never wrong, for example a log file whose lines are written in time order. Most real inputs, phones included, only allow a heuristic, so a heuristic watermark is sometimes wrong, and an event older than the watermark turns up anyway. Such an event is late data, and we'll need a policy for it.
Here are the Pune and Mumbai rides from section 2 passing through a counter with a 30-second bound. Each frame is one arrival. Watch the watermark and the 09:00 window.
You raise the bound from 30 seconds to 60 seconds and replay the same rides. What happens to the 09:00 count, and what does it cost?
4.3Trying it: a watermark in twenty lines
The scene stopped after r9. To see the whole run, including when the 09:01 window fires and what a more forgiving policy does, here is the same logic as a short program. It keeps one Counter per open window, moves the watermark to the largest event time minus the bound, fires every window whose end the watermark has passed, and frees the window's state once no more changes are allowed. Three more rides, r10 to r12, carry the stream on to 09:02. We'll explain the lateness parameter just after the output; the first run sets it to zero. Save as watermark.py and run python3 watermark.py.
from collections import Counter

def t(s):
    h, m, sec = map(int, s.split(":")); return h * 3600 + m * 60 + sec

def clock(secs):
    return f"{secs // 3600:02d}:{secs % 3600 // 60:02d}:{secs % 60:02d}"

rides = [  # (ride, city, event time, arrival time), in arrival order
    ("r1", "Pune",   "09:00:05", "09:00:06"), ("r2", "Mumbai", "09:00:20", "09:00:21"),
    ("r3", "Pune",   "09:00:40", "09:00:41"), ("r4", "Pune",   "09:00:55", "09:01:02"),
    ("r5", "Mumbai", "09:01:10", "09:01:11"), ("r6", "Pune",   "09:00:50", "09:01:15"),
    ("r7", "Pune",   "09:01:30", "09:01:31"), ("r8", "Pune",   "09:01:45", "09:01:46"),
    ("r9", "Pune",   "09:00:58", "09:01:50"), ("r10", "Mumbai", "09:02:05", "09:02:06"),
    ("r11", "Pune",  "09:02:20", "09:02:21"), ("r12", "Pune",  "09:02:40", "09:02:41"),
]

def run(bound, lateness):
    print(f"--- bound {bound} s, allowed lateness {lateness} s ---")
    windows, fired, watermark = {}, set(), -1    # window start -> Counter of rides per city
    for ride, city, ev, arr in rides:
        ev = t(ev)
        start = ev - ev % 60                     # the minute this ride belongs to
        if watermark >= start + 60 + lateness:   # its window has fired and been thrown away
            print(f"{arr}  {ride:<3} {city:<6} event {clock(ev)}  LATE, dropped")
            continue
        windows.setdefault(start, Counter())[city] += 1
        watermark = max(watermark, ev - bound)   # "nothing older than this is still coming"
        print(f"{arr}  {ride:<3} {city:<6} event {clock(ev)}  watermark {clock(watermark)}")
        if start in fired:
            print(f"          UPDATE {clock(start)[:5]}  {dict(windows[start])}")
        for w in sorted(windows):
            if w not in fired and watermark >= w + 60:
                fired.add(w)
                print(f"          FIRE   {clock(w)[:5]}  {dict(windows[w])}")
            if watermark >= w + 60 + lateness:
                del windows[w]                   # no more changes allowed: free the state
                print(f"          state for {clock(w)[:5]} freed")

run(bound=30, lateness=0)
run(bound=30, lateness=60)--- bound 30 s, allowed lateness 0 s ---
09:00:06 r1 Pune event 09:00:05 watermark 08:59:35
09:00:21 r2 Mumbai event 09:00:20 watermark 08:59:50
09:00:41 r3 Pune event 09:00:40 watermark 09:00:10
09:01:02 r4 Pune event 09:00:55 watermark 09:00:25
09:01:11 r5 Mumbai event 09:01:10 watermark 09:00:40
09:01:15 r6 Pune event 09:00:50 watermark 09:00:40
09:01:31 r7 Pune event 09:01:30 watermark 09:01:00
FIRE 09:00 {'Pune': 4, 'Mumbai': 1}
state for 09:00 freed
09:01:46 r8 Pune event 09:01:45 watermark 09:01:15
09:01:50 r9 Pune event 09:00:58 LATE, dropped
09:02:06 r10 Mumbai event 09:02:05 watermark 09:01:35
09:02:21 r11 Pune event 09:02:20 watermark 09:01:50
09:02:41 r12 Pune event 09:02:40 watermark 09:02:10
FIRE 09:01 {'Mumbai': 1, 'Pune': 2}
state for 09:01 freed
--- bound 30 s, allowed lateness 60 s ---
09:00:06 r1 Pune event 09:00:05 watermark 08:59:35
09:00:21 r2 Mumbai event 09:00:20 watermark 08:59:50
09:00:41 r3 Pune event 09:00:40 watermark 09:00:10
09:01:02 r4 Pune event 09:00:55 watermark 09:00:25
09:01:11 r5 Mumbai event 09:01:10 watermark 09:00:40
09:01:15 r6 Pune event 09:00:50 watermark 09:00:40
09:01:31 r7 Pune event 09:01:30 watermark 09:01:00
FIRE 09:00 {'Pune': 4, 'Mumbai': 1}
09:01:46 r8 Pune event 09:01:45 watermark 09:01:15
09:01:50 r9 Pune event 09:00:58 watermark 09:01:15
UPDATE 09:00 {'Pune': 5, 'Mumbai': 1}
09:02:06 r10 Mumbai event 09:02:05 watermark 09:01:35
09:02:21 r11 Pune event 09:02:20 watermark 09:01:50
09:02:41 r12 Pune event 09:02:40 watermark 09:02:10
state for 09:00 freed
FIRE 09:01 {'Mumbai': 1, 'Pune': 2}The first run is the scene, carried to the end. Notice line 6: r6 arrives with an event time older than r5's, and the watermark doesn't move, because it only ever goes forward. The 09:00 window fires at r7 with Pune 4, r9 is dropped as late, and the 09:01 window fires only when r12 pushes the watermark past 09:02:00. So the count for 09:01 reached the screen at 09:02:41 by the wall clock, roughly 100 seconds after its minute ended, because the watermark only moves when rides arrive. One simplification: a real Flink job computes the watermark periodically, every couple of hundred milliseconds, instead of after every event, but the rule is the same.
4.4What to do with late data
The second run differs in one setting, allowed lateness: how long, in event time, a window's state is kept after it fires so that late events can still update it. With 60 seconds, the 09:00 window fires at the same moment as before with Pune 4, but its counts aren't thrown away. When r9 arrives, it's added, and the window fires again with Pune 5, marked as an update. Its state is freed only when the watermark passes 09:02:00, one window length plus the 60 seconds of lateness later. Flink calls this setting allowedLateness, Kafka Streams calls it the grace period, and Spark folds it into withWatermark.
That leaves three things you can do with an event that arrives too late:
- Drop it. Flink's default. Spark also drops rows older than its watermark, though it doesn't promise to drop every one. You lose a little accuracy and keep no extra state. Flink counts what it drops in a metric,
numLateRecordsDropped, so you can see how much you're losing. - Keep the window open longer with allowed lateness, and send corrections. So the dashboard sees a number, then a better number. You pay in memory for every window kept open, and the downstream system has to cope with a count changing after it was shown.
- Send it somewhere else. Flink's
sideOutputLateDatasends late events to a separate stream. A nightly batch job can then fold them into the permanent record, while the live screen stays quick.
| Choice | Count reaches the screen | Late rides | Memory held |
|---|---|---|---|
| Small bound, no lateness | Soon | Dropped | One window per key |
| Large bound | Later, for every window | Mostly counted | A little more |
| Small bound plus allowed lateness | Soon, then corrected | Counted, as updates | Every window for the extra time |
| Small bound plus side output | Soon | Sent elsewhere | One window per key |
None of these is free. The Dataflow paper's title names the three things being traded, correctness, latency and cost, and the programmer's job is to choose the balance on purpose.
4.5Watermarks with many inputs
So far the counter has had one input. In a real job, the counter for Pune receives rides from every partition of the rides topic, each read by its own source instance, and each source computes its own watermark from what it has read. Partition 0 may have reached 09:05 while partition 3 is stuck at 09:02 because its reader was restarted.
Our counter can't use the fastest input's watermark, because partition 3 may still be about to deliver Pune rides from 09:02. So an operator with several inputs takes the minimum of their watermarks as its own. The Flink docs put it plainly: the watermark of an operator with two inputs "is defined as the minimum of both of its inputs".
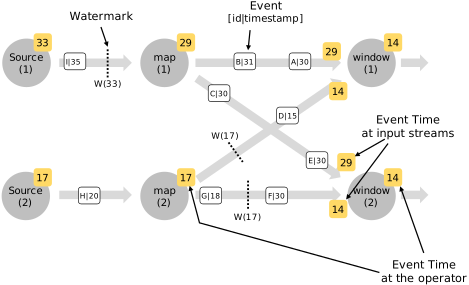
The minimum rule has a nasty corner. Suppose one partition of rides receives no events at all, perhaps because it only carries rides from a city that's asleep at 3 am. Its source never sees a new event time, so its watermark never moves, so the minimum never moves, and no window fires anywhere. So the dashboard freezes for every city.
The watermark tells the counter when a window is complete. But "only when complete" turns out to be too strict for the people looking at the screen.
05Deciding when to emit
5.1Early, on time and late
With a 30-second bound, the Pune bar for 09:00 appears roughly 30 seconds after the minute ends, and with a two-minute bound it would appear two minutes after. But the operations team would rather see a rough number straight away and have it fill in. That means the window should be able to emit more than once: some early partial counts, one count when the watermark says it's complete, and corrections for late events after that.
The rule that decides when a window emits its current result is called a trigger, and each result it emits is called a pane. By default, Flink and Beam fire once, when the watermark passes the end of the window, as in section 4. Our allowed-lateness run added a second rule, "fire again for each late event". In the Dataflow model, all of this is one thing you configure per window:
- Early firings, in processing time: "every 10 seconds, send whatever the count is so far". So the screen gets a growing bar during the minute.
- The on-time firing, when the watermark passes the window's end: the count the system believes is complete.
- Late firings, for events that arrive within the allowed lateness after that.
In Beam this reads almost like the list: AfterWatermark.pastEndOfWindow().withEarlyFirings(...).withLateFirings(...). Flink offers the same building blocks as Trigger classes, and Kafka Streams by default sends an updated result downstream whenever a count changes (batched by a small record cache), with its suppress operator available to hold results back until the window closes.
5.2What a second pane means
Once a window can fire more than once, the receiver needs to know how a new pane relates to the previous one. Suppose the 09:00 window fires early with Pune 2, then on time with Pune 4, then late with Pune 5. There are three ways to send that, and the Dataflow paper names them:
| Mode | Panes sent for Pune 09:00 | What the receiver must do |
|---|---|---|
| Accumulating | 2, then 4, then 5 | Replace the old value with the new one |
| Discarding | 2, then 2, then 1 | Add each pane to what it has |
| Accumulating and retracting | 2; then "remove 2" and 4; then "remove 4" and 5 | Undo the old value and apply the new one |
The dashboard's database adds every number it receives to the bar for that city and minute. The counter fires three panes for Pune 09:00 in accumulating mode: 2, 4, 5. What does the bar show?
Retractions matter when results feed further aggregation. If a later step sums rides per state from the per-city counts, and Pune's count is revised from 4 to 5, the sum needs to remove the old 4 before adding 5. Flink's Table API and SQL send exactly these retractions internally between operators, as pairs of "delete the old row" and "insert the new row".
5.3Four questions
Tyler Akidau's "Streaming 102" article (O'Reilly, 2016) sums up everything since section 3 as four questions you answer for every streaming computation:
| Question | Answered by | For the dashboard |
|---|---|---|
| What results are computed? | The operation | A count of rides per city |
| Where in event time are they grouped? | Windows | One-minute tumbling windows |
| When in processing time are they emitted? | Watermarks and triggers | Every 10 s early, on time at the watermark, then once per late ride |
| How do later results relate to earlier ones? | Accumulation mode | Accumulating, into a table that overwrites |
The first two questions are the same ones a batch job answers. Questions three and four exist only because the input never ends.
So far we've treated the counts as if they just exist somewhere. Our counter is holding open windows, counts per city, and its watermark, all in memory, on machines that can fail. That's the next problem.
06Where the counts live
6.1Keyed state
Everything a stream operator remembers between events is called its state. Our counter's state is a set of open windows and, for each one, a count per city. A filter that drops test rides has no state at all: each ride is judged on its own. A counter, a join, a deduplicator or a fraud rule that looks at a card's last ten payments all have state, and it's the state that makes stream processing hard.
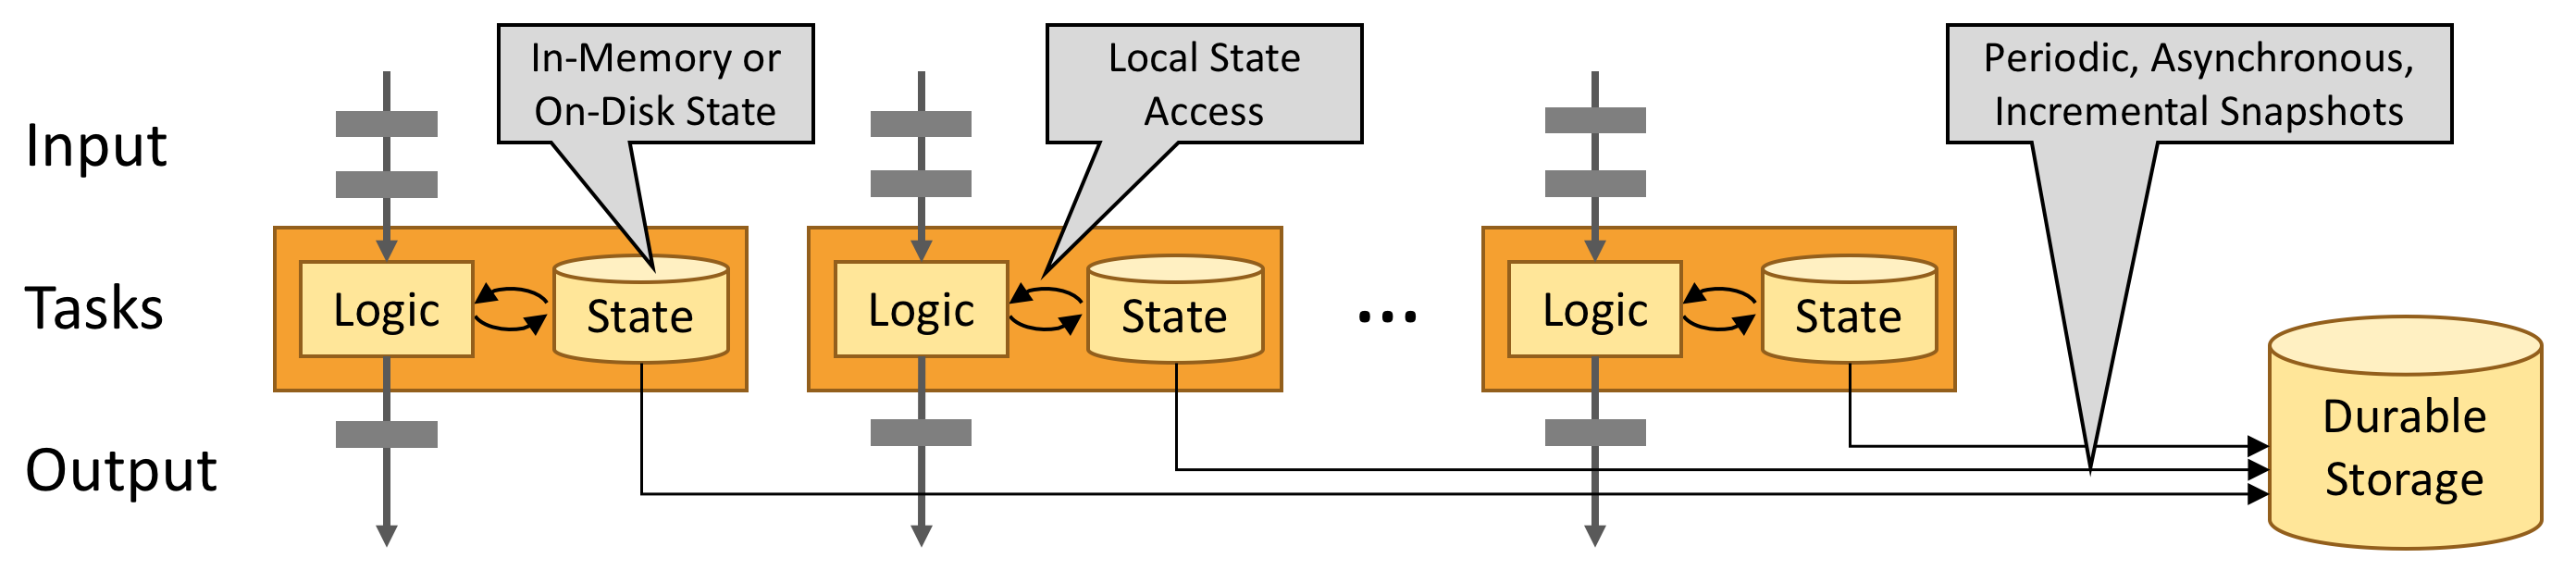
Section 1 routed every Pune ride to one instance of the counter. That routing is what lets the state be split cleanly: each instance holds the state for its own keys and nothing else. Flink calls this keyed state. Inside the counting function, code asks for "the count for the current key", and the framework returns Pune's count when a Pune ride is being processed. No instance ever needs another instance's state, so no locks and no network calls are involved in updating it.
?How does keyed state move when you add machines?
If the job goes from four counter instances to eight, half of each instance's cities have to move. Hashing each key straight to an instance number would reshuffle nearly every key, the problem chapter 29 solves with fixed partitions. Flink does the same: it hashes keys into a fixed number of key groups, set by the job's maximum parallelism (128 by default for small jobs), and assigns ranges of key groups to instances. Rescaling moves whole key groups, and the docs call them "the atomic unit by which Flink can redistribute Keyed State". Because the number of key groups is fixed when the job first starts, it caps how far the job can ever scale out without starting its state from scratch.
6.2State backends: memory or RocksDB
The part of the stream processor that stores keyed state is the state backend. Flink has two main ones, and the choice comes down to how much state there is.
The heap backend (HashMapStateBackend) keeps state as ordinary Java objects in memory. Reading and updating a count is as fast as a hash map lookup. Its limit is memory: state must fit in the heap of the JVM, the Java runtime Flink runs on, and a large heap brings long garbage-collection pauses, the moments when the Java runtime stops your program to free memory.
The RocksDB backend (EmbeddedRocksDBStateBackend) keeps state in RocksDB, an embedded key-value store that keeps its data in files on the local disk with a cache in memory. RocksDB is an LSM tree, the structure chapter 18 builds: writes go to an in-memory table and are flushed to sorted, immutable files. State can now be far larger than memory, hundreds of gigabytes per machine, at the price of turning every state access into a lookup that serialises the value to bytes and may touch the disk. Kafka Streams uses RocksDB for its state stores by default.
| Backend | Where state lives | Fits | Per-access cost | Used by |
|---|---|---|---|---|
| Heap | JVM objects in memory | Up to a few GB per machine | A hash lookup | Flink HashMapStateBackend |
| RocksDB | LSM tree on local disk, cache in memory | Far more than memory | Serialise, look up, maybe read disk | Flink EmbeddedRocksDBStateBackend, Kafka Streams |
| Remote (disaggregated) | Object storage, with a local cache | Effectively unlimited | Like RocksDB, plus remote reads on a miss | Flink 2.0's ForSt backend (2025) |
The third row is recent. Flink 2.0, released in March 2025, added a backend that keeps its primary copy of state in remote storage such as S3, so that machines can be replaced or rescaled without copying gigabytes of state to them first.
6.3State that never stops growing
For the dashboard, state stays small. Each window is freed when it fires (plus any allowed lateness), so the counter holds a couple of open windows per city. Other jobs aren't so lucky. A job that remembers every ride ID it has seen, to drop duplicates, keeps one entry per ride forever. A session window for a rider who never goes quiet never closes. Without a rule for forgetting, these grow until the machine runs out of disk.
Two tools keep state bounded. Timers let an operator schedule a callback at a future event time or processing time, which is how windows clean themselves up: the window registers a timer for "end of window plus allowed lateness", and the timer deletes the state. State TTL (time to live) lets you declare that a value expires some time after it was last written, so the deduplicator forgets ride IDs after, say, a day.
State now sits in memory or on a local disk on each machine. When one of those machines dies, its state dies with it, and that's the next problem.
07Surviving a crash: checkpoints
7.1What a crash takes with it
Suppose the machine running the Pune counter dies at 09:01:20. Its state is gone: the 09:00 window with Pune 4 in it and the half-built 09:01 window. Every other machine in the job is fine, and the rides themselves are safe in Kafka. What would it take to carry on as if nothing had happened?
Two things have to come back together. Counts must be restored to some earlier moment, and the input must be rewound to exactly the same moment, so that every ride after it is counted once more and every ride before it isn't. Kafka makes the second half possible, because a reader is only an offset, and rewinding an offset replays the rides. What's hard is the first half: a snapshot of the counts that matches a set of offsets exactly.
?Why not snapshot each instance whenever it likes?
Because the snapshots would describe different moments. Say the source instance saves "I've read up to offset 7" at 09:01:20, and the counter saves its counts at 09:01:21, after it has processed a ride at offset 8 that was already in flight. On recovery, the source replays offset 8 and the counter, whose snapshot already includes it, counts it a second time. A snapshot of a distributed job is only useful if every part of it describes the same cut through the stream: everything before it is in the state, and everything after it will be replayed.
An obvious way to get that cut is to stop the world: pause the sources, wait for every in-flight event to be processed, save every instance's state and offsets, and resume. It's correct, and on a busy job it means a pause of seconds every time you checkpoint, during which no counts move. Can we get the same cut without the pause?
7.2Chandy and Lamport's markers
Distributed systems solved this in 1985. K. Mani Chandy and Leslie Lamport's paper "Distributed Snapshots: Determining Global States of Distributed Systems" (ACM TOCS) records a consistent snapshot of processes connected by message channels, without stopping them. Their trick is a special message, a marker. Whichever process starts the snapshot saves its own state and sends a marker down every outgoing channel. Every other process, on receiving its first marker, saves its state and sends markers on all its own outgoing channels. Messages a process receives on a channel after saving its own state but before that channel's marker arrives are recorded as being "in the channel" at the snapshot moment, and they're part of the snapshot too.
Markers work because channels are first in, first out. Everything sent before a marker arrives before it, and everything sent after it arrives after it, so the marker divides each channel's traffic into "before the snapshot" and "after".
7.3Barriers in the stream
Flink's checkpoints are a variant of this, described by Paris Carbone, Gyula Fóra, Stephan Ewen, Seif Haridi and Kostas Tzoumas in "Lightweight Asynchronous Snapshots for Distributed Dataflows" (2015). They call it asynchronous barrier snapshotting. Flink's markers are called checkpoint barriers. The JobManager, Flink's coordinating process, tells every source to start checkpoint n. Each source records its position, for a Kafka source the offset of every partition it reads, and puts barrier n into its output stream, in line with the records.
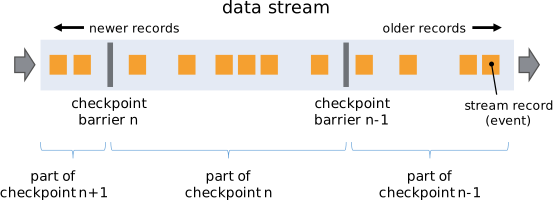
When an operator receives barrier n on its input, it knows its state now reflects exactly the records before the barrier. It saves its state, forwards the barrier to its outputs, and carries on. When the barrier has passed through every operator and every sink has acknowledged it, the JobManager marks checkpoint n complete. Together, the saved states and the sources' saved offsets form one consistent cut.
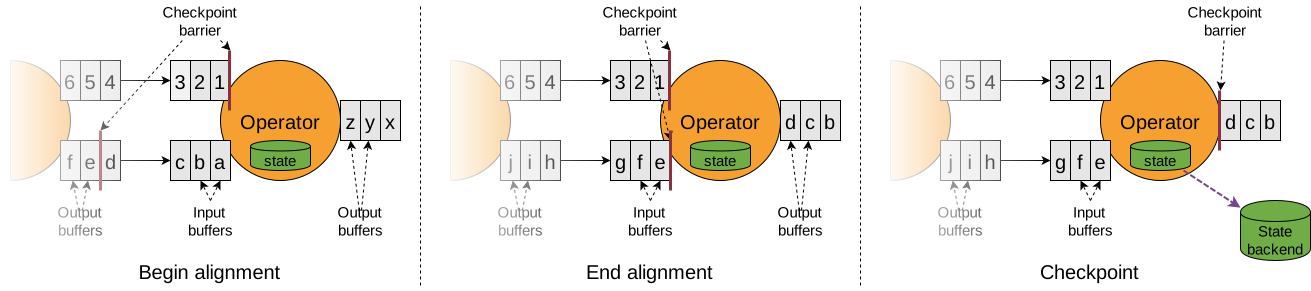
An operator with more than one input has one extra step. Our Pune counter receives rides from two source instances. Barrier n will arrive on one input before the other, and if the counter kept processing the fast input after its barrier, its state would include rides from after the cut. So it aligns: once barrier n arrives on an input, it holds back further records from that input, processes the other inputs until their barriers arrive too, then saves its state and lets everything flow again.
7.4What Flink leaves out, and why it's cheaper
Compare that with Chandy and Lamport. Their snapshot records the messages in each channel, because in general those messages are part of the system's state. Carbone et al. noticed that in an acyclic dataflow, which is nearly every streaming job, alignment makes channel state unnecessary: when an operator snapshots, it has consumed everything before the barrier on every input and nothing after it, so the in-flight records are all on the "after" side and will be replayed from the sources. In the paper's words, ABS "persists only operator states on acyclic execution topologies while keeping a minimal record log on cyclic dataflows". So the snapshot is just the operators' state plus the sources' offsets.
Another word in the title, asynchronous, is about the storage step. Our counter doesn't upload its state while holding up the stream. It takes a cheap local copy and keeps processing while the copy is written to durable storage in the background. With the RocksDB backend the local copy is nearly free, because RocksDB's files are immutable once written: the snapshot is a list of files, and incremental checkpoints upload only the files created since the last checkpoint. A job with 200 GB of state might upload only a few hundred megabytes per checkpoint, depending on how much of its state changed.
?Why does recovery replay anything at all?
Because checkpoints are taken every so often, not after every event. If the counter's machine dies at 09:01:20 and the last completed checkpoint is from 09:00:50, Flink restarts every operator from that checkpoint's state and rewinds every Kafka source to that checkpoint's offsets. Rides between the two moments are read and counted again. State ends up exactly as if the crash hadn't happened, but the job did the work twice, and anything it sent to the outside world in that half minute it sends again. Section 8 is about that second half.
So the checkpoint interval is a knob. Every 10 seconds means little replay after a failure and more checkpoint traffic all the time. Every 10 minutes means cheap checkpoints and up to ten minutes of rides re-read after a crash.
7.5When alignment hurts
Alignment makes one slow input hold up the others, and section 9 will show that under heavy load barriers can sit in long queues behind ordinary records. Two options exist for that. You can tell Flink to skip alignment and accept that, on recovery, some records are counted twice, which the docs call at-least-once mode. Or, since Flink 1.11 (2020), you can use unaligned checkpoints: the barrier overtakes the records queued in front of it, and those records are saved as part of the checkpoint. The Flink docs point out that this brings Flink closer to Chandy and Lamport's original algorithm, because it stores channel state after all. It makes checkpoints fast under load, at the cost of bigger checkpoints.
Flink also has savepoints, checkpoints you trigger by hand (flink savepoint <jobId>) and keep. You take one before upgrading the job's code, then start the new version from it, so the counts carry over.
08What "exactly once" means
8.1Exactly-once state
Stream processors advertise exactly-once processing, and section 7 is what they mean by it: after any number of failures, every operator's state is as if each event had been applied to it exactly once. After recovery, the Pune counter's state says 4 for 09:00, not 8, even though some rides were read twice. Some writers prefer the term effectively once, because the events were processed more than once; only their effect on state happened once.
That covers state inside the job. It says nothing about what the job did to the outside world before it crashed. In section 7's example, the 09:00 window fired at 09:01:31 and sent Pune 4 to the dashboard's database. If the crash comes before the next checkpoint completes, recovery rewinds to a point before the firing, replays the rides, and the window fires again. So the database receives Pune 4 twice.
8.2Trying it: a crash and a replay
Whether that second delivery does any harm depends on what the database does with it. This program plays a tiny job against three kinds of sink, the operator that writes results out of the job. It reads the first eight rides from a list standing in for the Kafka topic, checkpoints its state and offset every four records, and crashes after the seventh record, after the 09:00 window has fired and before the next checkpoint. It then restores the last checkpoint and replays. copy.deepcopy takes the snapshot, and step() is the same windowed count as before, with a 30-second bound.
- The add sink does
count = count + n, the way a counter in a database is usually bumped. - The upsert sink does
count = n, keyed by city and minute. (An upsert inserts a row, or overwrites it if the key already exists.) - The transactional sink buffers its writes and only makes them visible when a checkpoint completes, throwing them away if the job crashes first.
Save it as replay.py and run python3 replay.py.
import copy
from collections import Counter

def t(s):
    h, m, sec = map(int, s.split(":")); return h * 3600 + m * 60 + sec

log = [  # the Kafka topic: offset = position in this list
    ("r1", "Pune", "09:00:05"), ("r2", "Mumbai", "09:00:20"), ("r3", "Pune", "09:00:40"),
    ("r4", "Pune", "09:00:55"), ("r5", "Mumbai", "09:01:10"), ("r6", "Pune", "09:00:50"),
    ("r7", "Pune", "09:01:30"), ("r8", "Pune", "09:01:45"),
]

def step(state, offset):
    """Process one record; return the window results it fires."""
    _, city, ev = log[offset]
    ev = t(ev); start = ev - ev % 60
    state["windows"].setdefault(start, Counter())[city] += 1
    state["watermark"] = max(state["watermark"], ev - 30)
    out = []
    for w in sorted(state["windows"]):
        if state["watermark"] >= w + 60:
            out += [(city_, f"09:{(w - t('09:00:00')) // 60:02d}", n)
                    for city_, n in sorted(state["windows"].pop(w).items())]
    return out

def run(sink):
    state = {"windows": {}, "watermark": -1}
    checkpoint = (0, copy.deepcopy(state))            # (next offset to read, saved state)
    table, pending = Counter(), []
    offset, crashed = 0, False
    while offset < len(log):
        for city, minute, n in step(state, offset):
            if sink == "add":      table[(city, minute)] += n     # n = n + 4
            elif sink == "upsert": table[(city, minute)] = n      # n = 4, keyed by (city, minute)
            else:                  pending.append((city, minute, n))
        offset += 1
        if offset % 4 == 0:                            # checkpoint every 4 records
            checkpoint = (offset, copy.deepcopy(state))
            for city, minute, n in pending: table[(city, minute)] = n
            pending = []                               # the transaction commits with the checkpoint
        if offset == 7 and not crashed:                # crash after r7, before the next checkpoint
            crashed = True
            offset, state = checkpoint[0], copy.deepcopy(checkpoint[1])
            pending = []                               # an open transaction is aborted
            print(f"  {sink:<13} crash! rewind to offset {offset}")
    print(f"  {sink:<13} Pune 09:00 = {table[('Pune', '09:00')]}, Mumbai 09:00 = {table[('Mumbai', '09:00')]}")

for sink in ("add", "upsert", "transactional"):
run(sink) add crash! rewind to offset 4
add Pune 09:00 = 8, Mumbai 09:00 = 2
upsert crash! rewind to offset 4
upsert Pune 09:00 = 4, Mumbai 09:00 = 1
transactional crash! rewind to offset 4
transactional Pune 09:00 = 4, Mumbai 09:00 = 1All three runs had identical state after recovery: the job rewound to offset 4, the checkpoint taken after r4, and replayed r5 to r8. Only the sinks differ. The add sink received the 09:00 window twice and now says Pune 8 and Mumbai 2, double the truth, with no error anywhere. The upsert sink received it twice too, but writing 4 over 4 changes nothing. The transactional sink never showed the first delivery at all: it was still pending when the crash came, so it was thrown away, and only the replay's copy was committed at the next checkpoint.
That's the real meaning of end-to-end exactly-once: the state is exactly-once by checkpointing, and the outputs are exactly-once only if the sink is either idempotent or transactional. Kafka's docs say the same about Kafka's own transactions, as chapter 23 quotes: exactly-once delivery to other systems "generally requires cooperation with such systems".
8.3Idempotent sinks
An operation is idempotent if doing it twice has the same effect as doing it once, and the upsert sink is the cheapest way to get end-to-end exactly-once. It works whenever each result has a natural key and a full value: "Pune, 09:00 → 4" can be written any number of times. A Postgres INSERT ... ON CONFLICT (city, minute) DO UPDATE SET n = EXCLUDED.n, a Redis SET, or a write to a compacted Kafka topic keyed by city and minute all behave this way. It pairs naturally with accumulating panes from section 5, since each pane carries the full count.
It fails for results that can't be expressed as "set this key to this value": appending to a list, sending an email, charging a card, or adding discarding panes to a running total. For those, the sink has to make the outputs and the checkpoint commit together.
8.4Two-phase commit sinks
Making two things commit together, here a checkpoint and an external write, is the job of two-phase commit, which chapter 31 covers in general. Flink built it into its sinks in version 1.4 (2017), and its "end-to-end exactly-once" blog post (2018) describes the design. The checkpoint itself is the first phase:
Notice the last step. Once a checkpoint is complete, its transactions must commit, even if the job crashes in between, because the restored state assumes they did. So the external system must keep a pre-committed transaction alive until the job comes back. Kafka aborts transactions that stay open longer than transaction.max.timeout.ms, 15 minutes by default on the broker, and the Flink Kafka connector docs warn that the transaction timeout needs tuning "or data loss may happen when Kafka expires an uncommitted transaction".
8.5Kafka in, Kafka out
The most common pipeline reads from Kafka and writes to Kafka, and here the pieces from chapter 23 line up. Flink's source stores its Kafka offsets in the checkpoint itself (it commits them back to Kafka as well, but only so tools like kafka-consumer-groups.sh can show progress). Flink's Kafka sink with DeliveryGuarantee.EXACTLY_ONCE writes each checkpoint's output in one Kafka transaction, committed when the checkpoint completes. Downstream consumers must read with isolation.level=read_committed, or they'll see results from transactions that are later aborted.
Kafka Streams gets the same guarantee a different way. It's a library inside your application, not a separate cluster, and with processing.guarantee=exactly_once_v2 each task's input offsets, state-store updates (written to a compacted Kafka topic that records every change to the store, its changelog topic) and output records all go into one Kafka transaction, committed every commit.interval.ms, which drops from 30 seconds to 100 milliseconds when exactly-once is on. There's no separate checkpoint: Kafka's transaction is the checkpoint.
| Output | Exactly-once how | Visible after |
|---|---|---|
| Kafka topic, from Flink | Transaction per checkpoint, read_committed downstream | The checkpoint completes |
| Kafka topic, from Kafka Streams | exactly_once_v2: offsets, changelog and output in one transaction | The next commit, about 100 ms |
| Database table with a natural key | Upsert by key | Immediately |
| Database without a natural key | Two-phase commit sink, or store the Kafka offset in the same database transaction | The checkpoint completes |
| Email, payment, web hook | Not possible from the job alone; give each call an idempotency key the receiver checks | Immediately, possibly twice |
Everything so far has assumed the job keeps up with its input. Now we'll look at what happens when it can't, and about combining streams with each other.
09When a stage can't keep up
9.1A slow sink
At 18:00 on a Friday, the dashboard's database gets slow: someone is running a heavy report against it, and each write takes ten times as long as usual. Our counter keeps producing results at the usual rate, and the sink can only write a tenth of them. Where do the rest go?
There are three possibilities, and only one is good. The sink could drop results, which loses counts. It could queue them in memory without limit, which works until the machine runs out of memory and the job crashes, losing the queue. Or it could tell the operator upstream to slow down, which tells the operator upstream of it to slow down, all the way back to the source, which then reads from Kafka more slowly. Rides wait in Kafka, which was built to hold them, and the job catches up when the database recovers. This third option is called backpressure.
9.2How the pressure travels
Flink implements it with bounded buffers. Each connection between two operator instances has a fixed number of network buffers, a few tens of kilobytes each. A sender can only send when the receiver has a free buffer, and since Flink 1.5 (2018) the receiver tells the sender how many buffers it has free, a scheme called credit-based flow control: the sender never sends more than its credit. When the sink stops consuming, the counter's credit runs out, so the counter stops sending, so its own input buffers fill up, so its upstream's credit runs out, and so on back to the source.
Event time is what makes this harmless for correctness. The counts for 18:00 come out the same whether the rides were processed at 18:00 or at 18:05, because the windows and the watermark depend only on the rides' own timestamps. Processing-time windows would have produced a dip followed by a spike. So the dashboard is late but right.
Kafka Streams and Spark get the same effect without credits, because they pull: each consumer only fetches the next batch from Kafka once it has finished the last, so a slow stage polls less often. A system with no log in front of it has nowhere for events to wait, so backpressure must reach the original sender or something gets dropped, the queueing problem of chapter 42.
9.3Backpressure and checkpoints
Backpressure has a side effect on section 7. A checkpoint barrier travels in line with records, so when every buffer is full, the barrier waits behind all of them. Checkpoints that normally take two seconds take five minutes, or time out, and while they do, the job has no recent snapshot, so a crash would replay a lot. This is the situation unaligned checkpoints (section 7.5) were built for, since the barrier can overtake the queued records. Flink 1.14 (2021) added buffer debloating, which shrinks the amount of data held in buffers to what the job can process in roughly a second, so a barrier has less to wait behind.
10Joining streams
10.1Two streams, one question
The operations team adds a second line to the screen: rides requested but not picked up within ten minutes, per city. Pickups arrive on a second topic, pickups, as events like r3, 09:04:10. To answer, the job has to match each request with its pickup, a join.
In a database, a join reads both tables in full. Here neither "table" is ever complete, so the join has to remember one side while it waits for the other. When the request for r3 arrives, it's stored in state, keyed by ride ID. When the pickup for r3 arrives, the join looks it up, emits "r3 picked up after 3 m 30 s", and deletes it. A request still in state ten minutes after its event time is emitted as "not picked up". A pickup can arrive first, too, if the two topics are read at different speeds, so both sides need storing.
What decides the cost is how long to remember each side. Flink's interval join states it as a range: join a request with any pickup whose event time is between 0 and 10 minutes after the request's. Once the watermark passes a request's time plus ten minutes, no pickup can match it any more, and its state can be deleted. Join state is then bounded by roughly how many rides are requested in ten minutes. A join with no time bound must keep every request forever, which is section 6.3's growing state at its worst.
10.2Joining a stream with a table
The second common join enriches events with slowly changing reference data. Each ride carries a city, and the screen should group cities into regions using a cities table that's edited now and then. Looking the region up in a database for every ride would put a network call on every event, so stream processors bring the table into the job instead.
The table arrives as a stream of its own changes, a changelog: "Pune → West", then later "Pune → West-2". A compacted Kafka topic, which keeps the latest value per key (chapter 23), is the usual home for it. Our job reads the changelog into keyed state, holding the current row for each city, and each ride looks up its city locally. Kafka Streams calls this a KStream–KTable join: the KTable is the table built from the changelog, kept in a RocksDB state store.
?Which version of the table should an old ride see?
A replayed ride from last Tuesday should probably be joined with the region Pune had last Tuesday, not today's. Joining with whatever the table says now makes results depend on when the job ran, which breaks the rule that a replay gives the same answer. A temporal join keeps versions of each row by event time and joins each ride with the version valid at the ride's event time. Flink SQL writes it as JOIN cities FOR SYSTEM_TIME AS OF rides.event_time. Its cost is keeping old versions until the watermark says no event can need them.
| Join | Remembers | Bounded by | Example |
|---|---|---|---|
| Window join | Both sides, per window | The window | Requests and pickups in the same minute |
| Interval join | Both sides, for the interval | The interval plus watermark | Pickup within 10 minutes of request |
| Stream–table (current) | The latest row per key | The table's size | Ride → current region |
| Temporal join | Versions of each row | The watermark | Ride → region at the ride's time |
| Unbounded stream–stream | Everything, both sides | Nothing, unless you add TTL | Avoid |
11Two code paths or one
11.1The Lambda architecture
For years, stream processors weren't trusted to be exactly right. Early systems such as Apache Storm, as it was in 2011, offered at-least-once processing and had no event-time windows, so their counts drifted. Nathan Marz, Storm's creator, proposed a design for living with that in "How to beat the CAP theorem" (2011), later named the Lambda architecture. Run two systems side by side. A batch layer recomputes everything from the full history every few hours, slowly and exactly. A speed layer, a stream processor, computes approximate results for the hours the batch hasn't reached yet. Queries merge the two, and each batch run overwrites the speed layer's guesses with exact numbers.
It works, and it means writing the ride-counting logic twice, once for the batch engine and once for the stream engine, and keeping the two in agreement forever. Jay Kreps, writing in "Questioning the Lambda Architecture" (O'Reilly, July 2014), put it bluntly: "maintaining code that needs to produce the same result in two complex distributed systems is exactly as painful" as it sounds.
11.2The Kappa architecture
Kreps proposed keeping only the stream processor and using the log for everything the batch layer did. Keep the full history in Kafka, with retention as long as you need. To fix a bug or change the logic, "start a second instance of your stream processing job" reading from offset 0, writing to a new output table. When it has caught up, switch the dashboard to the new table and stop the old job. He suggested, half joking, "Maybe we could call this the Kappa Architecture".
Everything from sections 2 to 8 is what makes this work. Event-time windows and watermarks mean a replay of last month gives the same counts the live run gave, because nothing depends on when rides were processed. Exactly-once state means a crash during the replay doesn't change them. So the reprocessing job and the live job are the same code.
So if you might ever need to recompute, keep the raw events as well as the results. With Kafka, that means retention long enough for the replays you expect, or tiered storage that keeps old segments in object storage. A streaming job is only as reproducible as its input is replayable.
Lambda probably still has a place where the batch side does something the stream can't do cheaply, such as joins over years of history or training a model on a warehouse. And replaying a year of events through a streaming job can be slower and more expensive than one batch query over the same data stored in columnar files (chapter 24). Since 2014 the trend has been towards one engine that runs both, and Flink, Beam and Spark each claim to be it.
12The systems you'll meet
12.1Four designs
Every system in this section implements the ideas above, and they differ mostly in where they run and how they get fault tolerance.
Apache Flink runs as its own cluster: a JobManager that coordinates and TaskManagers that run operator instances. It processes one event at a time, with state in heap or RocksDB backends and recovery by the barrier checkpoints of section 7. It grew out of the Stratosphere research project at TU Berlin and became a top-level Apache project in 2014. Alibaba, Uber, Netflix and many others run it, and Flink 2.0 (2025) moved state into remote storage.
Kafka Streams is a Java library, not a cluster. You embed it in an ordinary application and run as many copies as you like. It reads only from Kafka and writes only to Kafka, and it uses Kafka for everything else: input partitions decide how work is split between copies, each state store is backed by a compacted changelog topic it can be rebuilt from, and exactly-once comes from Kafka transactions. In exchange for that simplicity, it can't read from anything else, and rebuilding a large state store from its changelog after losing a machine can take a long time. To shorten it, Kafka Streams supports standby replicas that keep a warm copy.
Google Cloud Dataflow and Apache Beam come from the Dataflow model paper. Beam is the programming model and SDK, a top-level Apache project since 2017, and a Beam pipeline can run on several engines, called runners: Google's managed Cloud Dataflow service, Flink, or Spark. The paper's ideas, event-time windows, watermarks, triggers and accumulation modes, are Beam's API almost word for word. Cloud Dataflow, generally available since 2015, adds managed autoscaling and keeps shuffle and state in Google's service instead of on the workers.
Spark Structured Streaming takes a different route. It treats a stream as a table that keeps growing and runs your query as a series of small batch jobs, called micro-batches, each over the rows that arrived since the last one. Each micro-batch is a deterministic batch job over a known range of Kafka offsets, so recovery is easy: rerun the batch. The Spark docs give end-to-end latencies "as low as 100 milliseconds" in this mode. Spark 2.3 (2018) added an experimental continuous mode for lower latency with at-least-once guarantees. Watermarks are set with withWatermark("event_time", "30 seconds"), and the design is described in the Structured Streaming paper (Armbrust et al., SIGMOD 2018).
| Flink | Kafka Streams | Beam on Cloud Dataflow | Spark Structured Streaming | |
|---|---|---|---|---|
| Runs as | Its own cluster | A library in your app | A managed service (or other runners) | Jobs on a Spark cluster |
| Processing | One event at a time | One event at a time | One event at a time | Micro-batches |
| State | Heap, RocksDB, or remote (2.0) | RocksDB, backed by changelog topics | Held by the service | Per-batch state store; RocksDB available |
| Fault tolerance | Barrier checkpoints | Kafka transactions and changelogs | Managed by the service | Re-run the batch from logged offsets |
| Sources and sinks | Many | Kafka only | Many | Many |
| Event time and triggers | Full | Windows, grace, suppress | Full; the Dataflow model's own API | Watermarks; fewer trigger options |
12.2Choosing
For the dashboard, all four would do, and the choice probably comes down to what your team already runs. Some rules of thumb follow from the table. If the data is in Kafka and the results go back to Kafka, Kafka Streams has the least to operate, since there's no cluster. If the state is large, the event-time logic is complicated, or there are many kinds of source and sink, Flink is the usual choice. If you're on Google Cloud and would rather not run anything, Dataflow. If the team already uses Spark for batch work and can accept latencies in seconds, Structured Streaming lets them use the same code and the same people.
13What it all costs
13.1Sizing the dashboard job
Let's put rough numbers on the dashboard and the pickup join, for an app that takes roughly 2,000 ride requests a second across 500 cities. These are assumptions for the arithmetic, not measurements of any real company, and each line says where it comes from.
| Ride requests | assumed | 2,000 /s |
| Counter state: cities × open windows × bytes | 500 × 2 × ~100 B | ~100 KB |
| Pickup join: requests held for 10 minutes | 2,000 /s × 600 s | 1.2 million |
| Join state at ~200 B per request | 1.2 M × 200 B | ~240 MB |
| Rides replayed after a crash, 1-minute checkpoints | up to 2,000 /s × 60 s | up to 120,000 |
| Same, 10-second checkpoints | 2,000 /s × 10 s | up to 20,000 |
| the join, not the count, decides the state backend | 100 KB vs 240 MB | |
The count fits anywhere. The join is two thousand times bigger, because it holds individual rides instead of totals, and it grows in step with the ten-minute interval: make it an hour and it's 1.4 GB, at which point the RocksDB backend and incremental checkpoints start to matter. Those replay numbers show why checkpoint interval is a trade: 120,000 rides is probably a second or two of catching up for a job that can process much faster than 2,000 a second, and a sink without exactly-once would show up to a minute of duplicated results.
13.2Where latency comes from
The delay between a rider tapping Request and the count appearing on the screen adds up from parts this chapter has met one by one:
Most of it is chosen, not imposed. The window, the bound and the checkpoint interval are settings, and each one trades freshness against completeness or cost. Only the first and last lines come from the outside world.
14Running a streaming job
14.1Watching it
Each question this chapter raised has a place to look on a running job.
# Is the job keeping up with its input? (sections 1 and 9)
kafka-consumer-groups.sh --describe --group dashboard-counter   # LAG per partition

# Is event time moving, or is an idle input holding it back? (section 4.5)
#   Flink metric per operator: currentInputWatermark  (compare it with the wall clock)

# How much data is arriving too late? (section 4.4)
#   Flink metric on window operators: numLateRecordsDropped

# Are checkpoints healthy? (sections 7 and 9.3)
curl -s http://jobmanager:8081/jobs/$JOB_ID/checkpoints      # durations, sizes, failures
#   Flink metrics: lastCheckpointDuration, lastCheckpointSize

# Which operator is slow? (section 9)
#   Flink metric per task: backPressuredTimeMsPerSecond, also on the web UI's job graph

# Before an upgrade (section 7.5)
flink savepoint $JOB_ID s3://bucket/savepoints/
flink run -s s3://bucket/savepoints/savepoint-xxxx new-version.jar
The most useful single graph is event-time lag: the wall clock minus each operator's current watermark. It rises when the job falls behind (backpressure or a slow source), when an input goes idle, and when the bound is too large, which are the three ways the dashboard goes stale.
14.2Rules that hold up
- Window by event time, stamped where the event happens. Processing-time windows give wrong counts whenever anything is delayed, and a replay gives different answers.
- Choose the watermark bound from the data. Measure how late events arrive, pick a bound that covers most of them, and decide explicitly what happens to the rest: drop, allowed lateness or side output.
- Mark idle inputs. One empty partition can stop every window from firing.
- Match the accumulation mode to the sink. Accumulating panes go to a sink that overwrites, discarding panes to one that adds.
- Give every piece of state an expiry. Windows expire on their own; joins, deduplication and hand-written state need TTLs or timers.
- Make sinks idempotent where you can, and transactional where you can't. Exactly-once state alone doesn't stop duplicate outputs.
- Set the checkpoint interval knowing it's also your output latency when the sink is transactional.
- Keep the raw events replayable, so a fixed job can recompute history from the same log.
14.3What you trade for what
| You get | You pay | When the bill arrives |
|---|---|---|
| Counts by event time | A watermark to estimate completeness | As late data dropped or windows firing late |
| A larger watermark bound | Every result is later | As a stale dashboard |
| Allowed lateness | Window state kept longer, and results that change | As memory, and as downstream confusion over updates |
| Keyed local state | Rescaling is limited by the key-group count | When you need to scale past it |
| RocksDB state | Serialisation and disk reads on every access | As lower throughput than the heap backend |
| Barrier checkpoints | Alignment stalls and replay after failure | Under backpressure, and after every crash |
| Transactional sinks | Results visible only per checkpoint | As output latency equal to the checkpoint interval |
| Backpressure | Growing lag instead of lost data | As a dashboard that's minutes behind |
14.4Symptom, cause, fix
| Symptom | Likely cause | Fix |
|---|---|---|
| Dashboard frozen, no errors, lag near zero | An idle partition holds the watermark back | withIdleness on the watermark strategy |
| Counts dip then spike after a restart | Processing-time windows | Window by event time |
Counts a little low, numLateRecordsDropped rising | Bound too small for how late events arrive | Raise the bound, add allowed lateness, or side-output late data |
| Counts double after a job restart | Additive sink without exactly-once | Upsert by key, or a transactional sink |
| Results appear in bursts, once a minute | Transactional sink and a one-minute checkpoint interval | Shorter interval, or an idempotent sink |
read_committed consumers stall after a job crash | A pre-committed transaction left open | Restart the job from its checkpoint so it commits; check transaction timeouts |
| Checkpoints slow or timing out, backpressure high | Barriers stuck behind full buffers | Fix the slow operator, or use unaligned checkpoints |
| State and checkpoint size grow every day | A join or hand-written state with no expiry | State TTL, interval joins, timers |
| Consumer lag grows steadily | The job is slower than its input | Find the backpressured operator; add parallelism there |
15Summary
- A stream processor keeps its answer and updates it per event, instead of recounting history like a batch job rerun every minute. A batch job is the special case whose input ends.
- Every event has an event time and a processing time, and they can differ by seconds or minutes. Counting by processing time turned Pune's 5 and 2 into 2 and 5.
- Windows slice event time: tumbling for "per minute", sliding for "last five minutes", sessions for bursts of activity separated by a gap.
- A watermark estimates completeness. It's the largest event time seen minus a bound, it moves with the data, and a window fires when the watermark passes its end. With several inputs, the operator takes the minimum, so one idle input stalls everything.
- Late data needs a policy: drop it, keep windows open with allowed lateness and send corrections, or send it to a side output. A larger bound counts more and reports later.
- Triggers decide when panes are emitted, early, on time and late, and the accumulation mode decides whether panes replace, add to or retract earlier ones.
- State is keyed and local. Each instance owns its keys' state, in memory or in RocksDB, and key groups let it move when the job rescales.
- Checkpoints are barrier snapshots. Barriers flow with the records, multi-input operators align them, and in an acyclic job only operator state and source offsets need saving (Carbone et al., 2015). Recovery restores state and rewinds Kafka.
- Exactly-once state isn't exactly-once output. A replay sends results again, so the sink must be idempotent (upsert by key) or transactional (two-phase commit on checkpoints), and the latter delays results by a checkpoint interval.
- Backpressure turns overload into lag. Bounded buffers push the slowdown back to the source, the events wait in Kafka, and event-time results come out right, only late.
- Kappa replaces Lambda's two code paths with one replayable log, which works because event-time results don't depend on when they're computed.
16Build this
A tiny event-time counter that survives being killed.
- Write a producer that sends ride events into a local Kafka topic with three partitions, stamping each with an event time and then delaying a random tenth of them by up to two minutes before sending.
- Write a consumer that counts rides per city per one-minute window by event time, with a watermark of "largest event time minus a bound" taken as the minimum over the three partitions. Print each window when it fires, and count what arrives late.
- Every ten seconds, save the window state and the three partition offsets together in one file, using the write,
fsync, rename procedure from chapter 08. On startup, load the file and seek each partition to its saved offset. - Kill the consumer with
kill -9at random moments and compare its output with a batch count over the whole topic. Then make the output idempotent by writing results to a table keyed by city and minute, and check that the duplicates disappear. - Finally, leave one partition with no traffic and watch the windows stop firing. Add an idleness timeout and watch them start again.
17Interview questions
beginnerWhat's the difference between event time and processing time, and which should a per-minute count use?›
Event time is when the event happened, stamped by whatever produced it. Processing time is when the stream processor handles it, read from the processor's clock. They differ by network delays, buffering on devices and the processor falling behind, by anything from milliseconds to hours.
A per-minute count of things that happened should use event time. Processing-time counts move events into whichever minute they happened to arrive in, so any delay or restart shows up as a fake dip followed by a spike, and replaying the input gives different answers.
beginnerExplain tumbling, sliding and session windows.›
Tumbling windows are fixed-size and don't overlap, so each event belongs to exactly one, like per-minute counts. Sliding (hopping) windows are fixed-size but start every interval and overlap, so an event belongs to size ÷ interval of them, like "the last five minutes, every minute". Session windows are per key and end after a gap of inactivity, so their lengths vary, and a late event can merge two sessions into one.
intermediateWhat is a watermark, and what happens to events that arrive after it?›
A watermark is a timestamp that flows through the stream and asserts that no events older than it are still expected. The common heuristic is the largest event time seen minus a bound on out-of-orderness. When an operator's watermark passes the end of a window, the window fires and its state can be freed. With several inputs, an operator's watermark is the minimum of its inputs', so an idle input can hold everything back unless it's marked idle.
Events older than the watermark are late. You can drop them (Flink's default, counted in numLateRecordsDropped), keep windows open for an allowed lateness and emit corrected results, or route them to a side output for separate handling. A larger bound means fewer late events and later results.
intermediateHow do Flink's checkpoints work, and how do they relate to Chandy–Lamport?›
The JobManager tells the sources to start checkpoint n. Each source records its input position, such as Kafka offsets, and emits barrier n in line with its records. Each operator, on receiving the barrier on all its inputs, saves its state and forwards the barrier. An operator with several inputs aligns: it holds back inputs whose barrier has arrived until the others' barriers arrive. When all operators and sinks have acknowledged, the checkpoint is complete. Recovery restores every operator's state and rewinds the sources.
It's a variant of Chandy–Lamport's marker algorithm. Chandy–Lamport also records messages in flight on each channel. Carbone et al. showed that with alignment, an acyclic dataflow doesn't need channel state, because in-flight records are all after the cut and will be replayed, so only operator state and offsets are saved. Unaligned checkpoints bring channel state back so barriers can overtake queued records under backpressure.
intermediateYour job uses exactly-once checkpointing, but the dashboard shows doubled counts after a restart. How?›
Exactly-once checkpointing makes the job's internal state correct, but after a crash the job replays input from the last checkpoint and emits any results it had already emitted since then a second time. If the sink adds each result to a running total, the replayed results are added twice.
Make the sink idempotent, writing each result as an upsert keyed by city and minute so a repeat changes nothing, or transactional, writing results in a transaction that commits only when the checkpoint completes, as Flink's two-phase commit sinks and Kafka transactions do. The second option delays results by up to a checkpoint interval.
deepWalk through how a two-phase commit sink gives end-to-end exactly-once in Flink, and what can go wrong.›
The sink writes each checkpoint period's output inside an open transaction in the external system. When the checkpoint barrier reaches it, it pre-commits, flushing so the transaction can be committed later and storing the transaction ID in its checkpoint state, and opens a new transaction. Once the JobManager has acknowledgements from every operator, the checkpoint is complete, which ends phase one. It then notifies operators, and the sink commits the transaction. If the job crashes after the checkpoint completed but before the commit, recovery finds the transaction ID in the restored state and commits it then. If it crashes before the checkpoint completed, the transaction is aborted and the replay rewrites its contents.
The failure modes: the external system must keep pre-committed transactions alive until recovery, and Kafka aborts transactions older than transaction.max.timeout.ms (15 minutes by default), which loses data if the job is down longer. Results are only visible per checkpoint, so latency equals the interval. And downstream Kafka readers must use read_committed, or they'll see aborted output.
deepDesign the 'not picked up within ten minutes' alert from a requests stream and a pickups stream. How big is the state?›
Key both streams by ride ID and use an interval join, or a keyed process function with timers. On a request, store it and register an event-time timer at request time plus ten minutes. On a pickup, look up the request, emit the wait time and delete both the state and the timer. If the timer fires first, emit "not picked up" for that ride's city and delete the state. Pickups that arrive before their request are stored briefly too. Watermarks drive the timers, so the alert is correct on replay.
State is bounded by the requests in a ten-minute window: at 2,000 requests a second, about 1.2 million entries, roughly a couple of hundred megabytes at 200 bytes each. That's comfortable in RocksDB with incremental checkpoints. Without the time bound, every request would be kept forever.
18Go deeper
A ride stamped 09:00:50 arrives when the watermark is 09:00:40. Is it late?›
No. It's older than other rides already seen, but late means older than the watermark. It goes into the 09:00 window, which hasn't fired yet.
One Kafka partition gets no traffic overnight, and the dashboard freezes for every city. Why?›
An operator's watermark is the minimum over its inputs. The idle partition's watermark never advances, so the minimum doesn't either, and no window fires. Marking idle inputs with withIdleness fixes it.
Why doesn't Flink's checkpoint store in-flight records the way Chandy–Lamport does?›
With aligned barriers in an acyclic graph, every in-flight record is after the cut, so it will be replayed from the sources. Only operator state and source offsets need saving. Unaligned checkpoints do store in-flight data.
Exactly-once is enabled with a Kafka sink, and results appear only once a minute. Why?›
The sink commits one Kafka transaction per checkpoint, and read_committed readers only see committed data, so results become visible at the checkpoint interval, here one minute.
Event-time windows, watermarks, triggers and accumulation modes as one model, from the team behind Google Cloud Dataflow. The design behind Apache Beam.
The two articles that made event time, watermarks and the what, where, when and how questions widely known, with animated diagrams.
The book-length version of the articles, adding exactly-once, persistent state and the relationship between streams and tables.
Asynchronous barrier snapshotting, the checkpoint algorithm behind Flink. arXiv 1506.08603.
Keyed state, key groups, incremental checkpoints and rescaling, as built in production.
The marker algorithm that every barrier checkpoint descends from.
Google's earlier streaming system, where low watermarks and exactly-once keyed state first appeared together.
The short essay that proposed replaying the log instead of running two systems, and named it Kappa.
Flink's own explanation of state, checkpoints, barriers, watermarks and lateness, with the figures used in this chapter.
19Related chapters
Partitions, offsets, consumer groups, compaction and Kafka transactions: the log every job in this chapter reads from and writes to. Chapter 23.
Why the phone's clock and the server's clock disagree, and what happened-before means when there's no shared clock. Chapter 26.
The LSM tree inside RocksDB, the state backend for large jobs. Chapter 18.
Two-phase commit, idempotency keys and what exactly-once can and can't mean across systems. Chapter 31.
Fixed partitions and moving keys between machines, the idea behind key groups. Chapter 29.
What happens to queues when arrivals outpace service, the problem backpressure exists to contain. Chapter 42.