A browser asks your server for a user's profile page, and your server starts on the request. First the handler reads the request and builds a database query. That takes the processor about 1 millisecond of work, which we'll call CPU time, the time the processor spends executing your instructions. Then the handler sends the query and waits for the answer, which takes about 50 milliseconds. When the answer arrives, it sends the page back to the browser.
Out of those 51 milliseconds, the processor was busy for one. For the other fifty it had nothing to do for this request, and a real server doesn't get one request at a time. It gets thousands, all in the same state. If we handled them one after another, every request would wait through the 50 milliseconds of the one before it, and the processor would sit idle about 98% of the time. The way out is to start the next request while this one waits. That needs something to remember where each waiting request had got to, and something to decide when to move from one request to another.
Those two jobs, holding a request's place and deciding when to switch, are what a concurrency model provides. There are five common ones: threads, an event loop, async/await, goroutines and actors. This chapter follows one request, request 7, through each of them. We start with the simplest, a thread for every request, and watch where it strains. Each strain leads to the next model, and at the end we put the costs side by side and work out how to choose.
01A request that mostly waits
1.1How many requests a core needs in flight
Say the server has ten thousand connections open, each carrying a request like request 7. A core is one processor that runs one stream of instructions at a time, and we'll count how many requests a single core must have in progress to stay busy. Request 7 needs the core for 1 ms and then needs nothing from it for 50 ms. While it waits, the core is free to work on other requests, so the question is how many it takes to fill those 50 ms.
Here is the arithmetic: a request that computes for 1 ms and waits for 50 leaves room for about 50 others, so one core needs roughly 51 requests in progress to stay busy. Ten thousand open connections is far more than a core needs, so waiting requests are never in short supply. What matters is what each one costs to hold.
?Why not just serve them one at a time?
Because the core would sit idle for 50 ms of every 51. Serving requests in sequence uses about 2% of the CPU you paid for, and a request arriving behind a hundred others would wait about five seconds before its turn came.
So the real choice is how to keep dozens of requests per core in progress at once, and what each request in progress costs us.
1.2Two decisions every model makes
Think of a restaurant. It can give every table its own waiter, who stands beside the table the whole meal, even while the kitchen cooks. Or one waiter can take an order, hand it to the kitchen, and move on to the next table, coming back when a dish is ready. The first design is simple and needs a waiter per table. The second needs far fewer waiters, but each of them must never stand still, and the whole room stalls if one does.
A server faces the same choice, and it comes down to two decisions.
First comes what holds a request's place while it waits. Request 7 has some variables: which user it's for, the query it built. Something has to keep them, and keep track of which line of the handler to run next, until the database answers. One answer is a whole thread, a path of execution through your program that has its own stack, the memory holding the local variables and return points of every function it's in the middle of. The kernel decides which threads run on which cores. The other answer is a small record that the program keeps itself.
Second comes who decides when to stop running one piece of work and start another. The kernel can take a thread off the processor at any instruction, whether the thread agrees or not, and that is called preemption. The alternative is cooperative switching, where a piece of work keeps the processor until it reaches a point, which the code marks, where it hands it back.
Most of the differences between the five models follow from how each answers those two questions, and from what it costs to create and switch the unit of work. The most direct answer to the first question is to give every request a thread.
02One thread per request
2.1Blocking code, and the kernel switches
With a thread per request, we write plain code. The handler for request 7 reads the request, builds the query, sends it down a socket, the program's handle on a network connection, and then calls read() on that socket to get the answer. A call that doesn't return until its result is ready is a blocking call, and read() on an empty socket is one. We write nothing special to deal with the wait, and what happens next is the kernel's job.
Here is request 7's thread, with two other threads for company. Notice who does the switching: the scheduler, the part of the kernel that picks which thread runs next on each core, and never the code itself.
A switch costs more than saving one thread's registers and loading another's. The processor's caches and its TLB, the small table it uses to translate memory addresses (chapter 04), are full of what the previous thread was using, so the new thread runs slowly for a while as it warms them up again. The 1 to 5 µs figure includes that warming up.
What we get for the cost is code that reads as a straight line. Each request is one function, and a stack trace shows exactly where request 7 is.
?Why is preemption worth having?
Because nothing one thread does can hang the others. If request 8's handler gets stuck in a loop that never ends, request 7 still gets its turns, since the kernel takes the processor away from thread 8 when its time is up. The cooperative models later in the chapter can't promise that: there, a unit that never reaches a switching point keeps the processor. (Go's runtime and Erlang's both add a form of preemption of their own, which we'll meet in sections 5 and 6.)
2.2What each thread costs
Every waiting request keeps a whole thread alive, and a thread is not small. It has its own stack, and on Linux each new thread's stack reserves 8 MB of virtual address space by default, meaning a range of 8 MB of addresses set aside for it (chapter 04). Reserving addresses doesn't use RAM. The kernel gives the stack real memory one page at a time, only when the thread first touches that page, so a thread that uses a few kilobytes of stack costs a few kilobytes of RAM for it. The kernel also keeps a record for each thread, and its scheduler (chapter 06) has to keep track of all of them.
A few thousand threads is usually fine. A hundred thousand gets painful.
?Why can't you just create a hundred thousand OS threads?
The stacks look like the obvious problem, since a hundred thousand of them reserve 800 GB. But a 64-bit process has room for far more addresses than that (about 128 TB on Linux on x86-64), and only the touched pages cost RAM, so the reservation on its own doesn't stop you. Three other things do. The kernel caps how many threads, and how many separate memory regions, a system may have, and every thread stack is one more region. Each thread uses real memory for the stack pages it touched and for its kernel record, and a hundred thousand small amounts add up. And switching starts to eat the CPU you wanted: with more threads wanting a turn, the scheduler does more switches, and each one leaves the caches colder. Section 4.2 measures what a waiting thread costs in practice.
| OS threads | |
|---|---|
| Best for | CPU-bound work, and any concurrency count under about a thousand. Easiest to debug by a wide margin. |
| Breaks | Above a few thousand units. Each reserves an 8 MB virtual stack on Linux, uses real memory for the part it touches, and adds to the scheduler's work. |
2.3Thread pools
There's a second cost, and it's paid in time. Starting a thread takes the kernel a noticeable while, and if the handler is short, creating a thread for each request can cost more than handling the request. Section 7 puts a number on that.
So servers create a fixed set of worker threads once, put arriving requests in a queue, and let each worker take the next request when it's free. That's a thread pool. A pool of N workers also limits how many requests are in progress to N, and the rest wait in the queue. That limit is called backpressure, a system pushing back on load instead of accepting more than it can do, and a pool gives it to you for free.
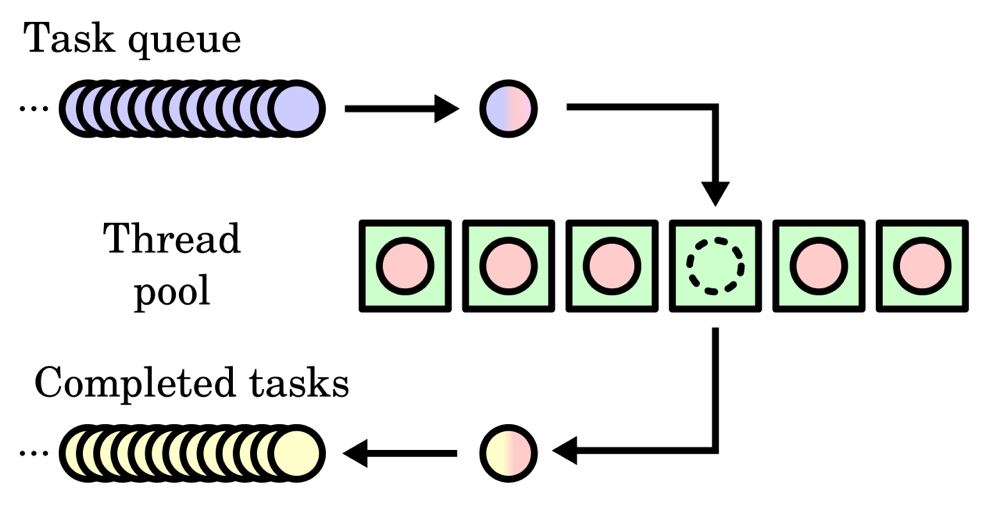
The limit has a catch for our workload. With blocking code, a worker is stuck inside a request for its whole 51 ms, and a waiting request still occupies a worker. A pool of eight workers on an eight-core machine could therefore have only eight requests in progress at once, every one of them stuck waiting for the database, when the arithmetic from section 1 asked for 51 per core, about 400 across eight cores. With blocking code, the pool has to be as big as the number of requests you want in flight, which brings back the cost of a thread for every one of them.
A thread that is only waiting still carries a stack and a kernel record. We'd like request 7 to cost much less than that while it waits, which suggests letting one thread look after all the waiting requests.
03The event loop
3.1Asking the kernel what's ready
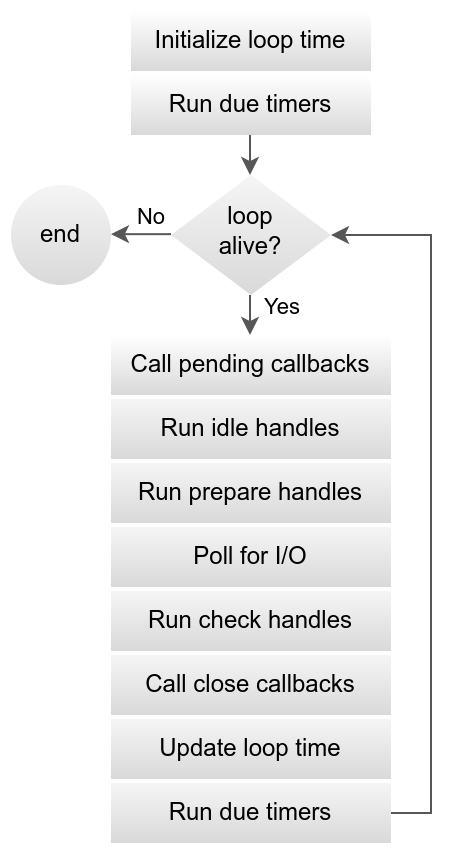
If one thread serves every request, it can never wait on any single one, because while it waited for request 7's database it would stop serving all the others. So the program needs a way to ask "which of my connections have something for me right now?" and then to deal with exactly those.
Two kernel features make that possible. A non-blocking socket never makes the caller wait: a read on it returns at once, either with data or with "nothing yet". The second feature tells the program when trying is worth it. We'll say a socket is ready when there is something to do with it, such as data waiting to be read. epoll, on Linux (macOS and the BSDs have kqueue instead), lets a program hand the kernel a whole list of sockets and then call epoll_wait(), which sleeps until at least one of them is ready and returns the ready ones. Chapter 07 shows these calls from the kernel's side.
With those, the server becomes one thread running a loop: ask which sockets are ready, do a little work on each, and ask again. That's an event loop. Because the only waiting it does is inside epoll_wait(), one slow request can't hold up the others.
There's one more piece. When request 7's handler sends its query, it has to stop and let the loop move on, but someone must finish request 7 when the answer comes. So before stopping, the handler leaves behind a callback, a function stored away to be run later, together with the values it will need. The loop keeps callbacks in a table, keyed by the socket each one is waiting on. Here is request 7 going through it.
epoll_wait(). This is the only place it is allowed to wait. Request 7's bytes have just arrived on connection 7.An event loop lets nginx and Node.js hold huge numbers of connections open with almost no memory per connection: a waiting request is one small record in the table, and no thread is sitting on a stack waiting for it.
3.2Where the cost moves
The waiting got cheap, and the cost moved into your code. Nothing may ever block, so every "wait for the database" has to become a callback that runs later. The logic of request 7, which was one straight function with a thread, is now split into pieces. One piece runs when the request arrives and another runs when the database answers.
Any local variable that the second piece needs has to be saved by hand somewhere in between, because the first piece has returned and its stack is gone. And a stack trace no longer shows how you got here: when the callback runs, the only thing under it on the stack is the loop.
We've traded the readable code for the cheap waiting. The next two models try to get both, from opposite ends. The first keeps the event loop and gets the compiler to write the callbacks for us.
04async/await
4.1A function compiled into a state machine
That first approach is async/await. You write the handler as if it were blocking code, mark the function async, and write await at each place where it has to wait. JavaScript, Python, C# and Rust (with a library such as Tokio) all work this way. The compiler (or the language runtime) then does what we did by hand in section 3.2: it turns the async function into a state machine, a small object that records which await the function is paused at and the values of the variables still needed after it. Each paused-and-resumed run of an async function, request 7's handler for example, is called a task. The library that runs tasks on top of an event loop is called an executor.
Request 7's handler runs like ordinary code up to the first await. At that point the task returns to the executor, which keeps its state machine and runs other tasks. When epoll reports the reply, the executor calls the task again and it picks up just after the await.
await.A state machine's size depends only on the variables that are live across an await, and it has no stack at all, so we call it stackless. In Rust a small task can come out under 100 bytes, so a million concurrent tasks is reasonable there.
A task can only pause at points the compiler knew about in advance, and marking those points is the whole job of await. That also answers the second decision from section 1: switching is cooperative, and the code itself says where.
4.2Measuring what a waiting request costs
We now have two ways to hold a waiting request: a thread with its stack, or a small state-machine object. Let's measure the difference with the cheapest kind of work there is, a unit that only waits.
The script below runs N units that each sleep for one second, standing in for requests waiting on a database. It runs them either as OS threads or as asyncio tasks (asyncio is Python's async/await library) and reports the total time and the extra memory used. asyncio.gather starts all the tasks together and waits for every one. The function peak_mb asks the kernel for the process's peak resident memory, meaning the most the process has held in RAM at once, through resource.getrusage. macOS reports that in bytes, and Linux reports it in kilobytes, so on Linux change 1e6 to 1e3.
2,000 threads and 2,000 async tasks each sleep for one second. How do the two runs compare?
Save the script as conc2.py.
import asyncio, resource, sys, threading, time

def peak_mb():                                      # macOS reports bytes
    return resource.getrusage(resource.RUSAGE_SELF).ru_maxrss / 1e6

async def nap():
    await asyncio.sleep(1)

async def run_async(n):
    await asyncio.gather(*(nap() for _ in range(n)))

def run_threads(n):
    ts = [threading.Thread(target=time.sleep, args=(1,)) for _ in range(n)]
    for t in ts: t.start()
    for t in ts: t.join()

kind, n = sys.argv[1], int(sys.argv[2])
base = peak_mb()
t = time.perf_counter()
asyncio.run(run_async(n)) if kind == "async" else run_threads(n)
took = time.perf_counter() - t
print(f"{n:>7,} {kind:<7} each sleeping 1 s: {took:4.2f} s total, +{peak_mb() - base:6.1f} MB peak memory")python3 conc2.py threads 2000
python3 conc2.py async 2000
python3 conc2.py async 100000 2,000 threads each sleeping 1 s: 1.49 s total, + 76.8 MB peak memory
2,000 async each sleeping 1 s: 1.02 s total, + 2.9 MB peak memory
100,000 async each sleeping 1 s: 1.40 s total, +156.7 MB peak memoryAll three runs finish in one to one and a half seconds (timings vary from run to run), because the work is only waiting, and that holds even for 100,000 tasks. The memory is where they differ. Two thousand threads added 76.8 MB, about 38 KB for each thread, and 2,000 tasks added 2.9 MB, about 1.5 KB for each task. The 100,000-task run stayed close to that rate, at 157 MB.
Notice that 38 KB is far below the megabytes of stack address space each thread reserves (section 2.2). The 38 KB is the memory each thread touched, as section 2.2 predicted: the reservation costs addresses, and only touched pages cost RAM. These are Python's numbers, and a Python task is much larger than the under-100-byte state machines Rust can produce, but the gap of about twenty-five times is the point.
Async pays for that saving in two places. The first is in how you write code.
4.3Function colouring
You can only write await inside an async function. Say request 7's handler calls load_user(), and load_user() becomes async because it now talks to the database. The handler has to await it, so the handler must become async too, and so must whatever calls the handler. The only other way for an ordinary function to call an async one is to block until it finishes (Python's asyncio.run, Tokio's block_on), which is exactly the waiting we were trying to avoid.
?Why does async spread through a codebase?
Because the requirement passes up the entire chain of callers. Adding one async function to a library can force every user of the library to restructure. Bob Nystrom's 2015 essay What Color Is Your Function? named the problem, and it's still the clearest statement of it. The metaphor is that functions come in two colours, and a function of one colour can't call the other without ceremony.
4.4One blocking call stops the executor
The second place async pays is at run time, and it's the failure async systems are best known for. An executor doesn't give each task its own thread. It runs a small number of worker threads, often one per core, and each worker runs one task at a time until that task reaches an await. A task that blocks the whole thread instead of pausing at an await takes that worker out of service completely. Look at this Rust handler, running on Tokio. std::fs::read is Rust's ordinary file read, which blocks the calling thread until the data is in memory:
// Tokio, 8 workers on an 8-core box
async fn handler() -> Response {
    let data = std::fs::read("/big/file")?;   // BLOCKS the worker thread
    process(data)
}Eight requests hit this handler at the same moment, on a Tokio runtime with eight workers. What does the rest of the service do while the reads run?
Here is the same thing drawn smaller, with two workers.
You can see the same effect with a few lines of Python and no Rust. One task prints a tick every tenth of a second, and a second task waits for half a second. In the first run it waits with asyncio.sleep, which pauses the task and lets the loop carry on. In the second it waits with time.sleep, which blocks the thread and so blocks the loop's only thread.
import asyncio, time

async def ticker():
    start = time.perf_counter()
    for _ in range(6):
        await asyncio.sleep(0.1)
        print(f"  tick at {time.perf_counter() - start:4.2f} s")

async def polite():
    await asyncio.sleep(0.5)      # waits, and lets the loop run other tasks meanwhile

async def rude():
    time.sleep(0.5)               # waits while holding the loop's only thread

async def main(label, other):
    print(label)
    await asyncio.gather(ticker(), other())

asyncio.run(main("another task calls asyncio.sleep(0.5):", polite))
asyncio.run(main("another task calls time.sleep(0.5):", rude))another task calls asyncio.sleep(0.5):
tick at 0.10 s
tick at 0.20 s
tick at 0.30 s
tick at 0.40 s
tick at 0.50 s
tick at 0.61 s
another task calls time.sleep(0.5):
tick at 0.51 s
tick at 0.61 s
tick at 0.71 s
tick at 0.81 s
tick at 0.91 s
tick at 1.01 sIn the first run the ticks arrive every tenth of a second, so the ticker never noticed the other task waiting. In the second, the first tick was due at 0.10 s and printed at 0.51 s, right after the blocking sleep ended. For half a second nothing else in the program ran, and no error was raised. That's the Tokio picture at one worker's scale, and a real service with thousands of connections feels it as every request stalling at once. (Python can find this for you: running with asyncio.run(main(), debug=True) logs any step that holds the loop for more than 0.1 seconds.)
Anything that keeps a worker's thread busy without reaching an await does the same: waiting on a lock that blocks the thread (Rust's std::sync::Mutex, held while something slow happens), a database driver written for blocking code, or a CPU loop that runs longer than a few milliseconds. The fixes are spawn_blocking for the call, a library written for async, or an explicit yield inside long loops.
| async / await | |
|---|---|
| Best for | Hundreds of thousands of mostly-idle I/O-bound connections, where per-unit memory is the binding constraint. |
| Breaks | One blocking call poisons the executor. And function colouring propagates through your entire call graph. |
Async has made a waiting request cheap, but it did it by changing the language, and one stray blocking call can undo it. There's another way to get cheap units: keep ordinary blocking code, and make the thread itself cheap.
05Goroutines and virtual threads
5.1A thread the runtime manages
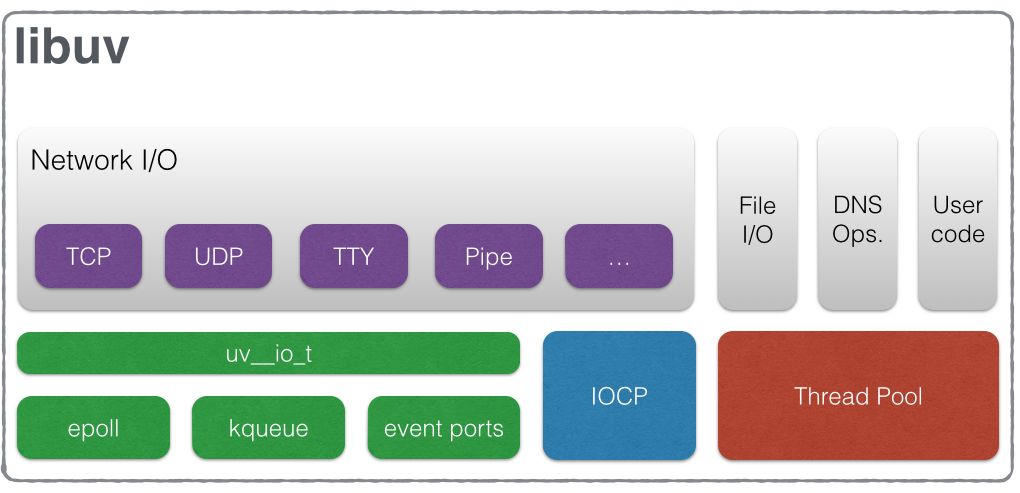
A goroutine in Go, or a virtual thread in Java 21, is a thread-like unit that the language's runtime, the support code compiled into every program in that language, creates and manages itself, without asking the kernel for a new thread each time. The runtime spreads many of them over a few real OS threads, usually about one per core. A goroutine starts with a stack of about 2 KB, and when it needs more, the runtime copies it into a bigger one. Switching from one goroutine to another costs around 100 ns, about ten to fifty times less than a thread switch, because the runtime does it inside the program and never enters the kernel.
Like a thread, and unlike an async task, a goroutine has a real stack of its own, and a unit with its own stack is called stackful. When request 7's goroutine calls a function that has to wait, such as a network read, the runtime parks that goroutine, with its stack, and runs another one on the same OS thread. Underneath, Go's runtime uses epoll (or kqueue on macOS) exactly as the event loop in section 3 did. Your code just calls the function and reads the answer on the next line.
Go switches goroutines mostly at points where they wait, but since Go 1.14 its runtime can also interrupt a goroutine that has run too long without waiting, so a goroutine stuck in an endless loop no longer hogs its OS thread. That brings back much of the protection preemption gave threads in section 2.1.
?Why don't goroutines need an async keyword?
Because they have a stack. A function in the middle of a chain of calls can wait, and the functions above it stay safely on the paused stack, so any function can block and the runtime switches underneath it. There's no async keyword and no colouring. Go answered Nystrom's problem this way, while Rust accepted the colouring and got tasks with no stack at all.
5.2When a goroutine makes a blocking call
Stackful units have a second advantage, and it's the answer to section 4.4's freeze. Go programs can call libraries written in C, through a mechanism named cgo, and the Go runtime can't see inside C code to park it. A blocking cgo call is exactly the kind of call that froze the Tokio workers. In Go it costs one extra OS thread instead.
The same hand-over happens when a goroutine makes a blocking system call of its own. The runtime gives the stuck OS thread's queue of goroutines to another OS thread, so one stuck call costs one thread and never the whole program.
5.3Work stealing, and what it costs
Both Go's scheduler and Tokio's multi-threaded runtime have to keep all of their OS threads busy, and that raises a problem. Each worker keeps its own queue of runnable tasks, because a single shared queue would need a lock, a guard that lets only one worker at a time touch the queue, and every worker would fight over it. One worker's queue can fill up while another's runs dry. The fix, used by both runtimes, is work stealing: an idle worker takes tasks from a busy worker's queue. That improves utilisation, and it has a price.
?What does stealing cost?
It costs locality, meaning the benefit of running near the data you used last. Request 7's task can pause on one core and resume on another, so anything it had warm in the first core's cache is gone, and any code that assumed it would stay on one thread breaks. For short tasks, the steal itself can cost more than the work it made possible.
Runtimes soften this in a few ways. Go and Tokio take about half of the victim's queue in one steal, so the cost is paid once for many tasks. Some other designs, such as Cilk and Java's ForkJoinPool, have the thief take from the opposite end of the queue to the one the owner uses, so the owner keeps working locally without synchronisation. Where you can't tolerate migration at all, Go has runtime.LockOSThread, which keeps a goroutine on one OS thread, and Tokio has spawn_local, which keeps a task on the thread that spawned it.
| Goroutines (stackful green threads) | |
|---|---|
| Best for | High concurrency where you still want to write ordinary blocking code. The best ergonomics of the four so far. |
| Breaks | Memory at very high counts, since every unit carries a growable stack. And you inherit a garbage collector. |
Every model so far has the same property under the surface: all the units can reach the same memory. That is convenient, and it brings problems of its own.
06Actors
6.1State you reach only by message
When units share memory, two of them changing the same variable at once can corrupt it. Say requests 7 and 8 both add one to a shared counter of pages served: each reads the old value, adds one, and writes it back, and if they interleave, one of the additions is lost. So the program needs locks, the guards we met briefly in section 5.3, which make units take turns on shared data (chapter 13 covers them). And a unit that crashes halfway through an update can leave the shared data half changed, for everyone else to find.
The fifth model leaves switching alone and changes what is shared. An actor keeps its state private and is reachable only by sending it messages. Each actor has a mailbox, a queue of messages waiting for it, and handles one message at a time, so nothing else can touch its state, and there's nothing to lock. Request 7 as an actor would send a "query" message to a database actor and carry on with other messages, and the reply would arrive later as a message in its own mailbox. Erlang is built entirely on this idea, and WhatsApp's servers ran on Erlang. Erlang's runtime also preempts its actors: each one gets a fixed budget of work before the runtime switches to another, so a runaway actor can't hog a thread either.
?Why accept a message send on every interaction?
For a boundary that nothing else here offers. One actor can crash and be restarted by its supervisor, another actor whose only job is to watch it, without corrupting anyone else's state. That's worth real overhead in systems where partial failure is routine and expected, such as telecoms, and dead weight in most others.
| Actors | |
|---|---|
| Best for | Systems needing a per-unit failure boundary and supervision. Telecoms, and stateful distributed services. |
| Breaks | Message-passing overhead on every interaction, and mailboxes that grow without bound under sustained overload. |
That last weakness, a queue with no limit, shows up in every model in a different form. First, though, let's put numbers on what the five cost.
07What creating and switching cost
7.1127 round trips to make one thread
Section 2.3 said that creating a thread takes a noticeable while. Here are two numbers for a fast laptop (they vary between machines and with load): the time to create a thread and wait for it to finish, and the time for a message to go to a thread that already exists and come back.
Creating a thread takes as long as about 127 round trips to a thread that already exists. Handing a request to an existing worker is the round trip, so this ratio is the case for the thread pools of section 2.3.
?Why does that one ratio decide thread pools?
Because if a work item is shorter than about 14 microseconds, you spend more time making the worker than using it. Take a tiny handler that does 200 ns of work:
| Thread create + join | from the table above | 13,840 ns |
| Work item duration | a small request handler | 200 ns |
| Overhead ratio | 13,840 / 200 | 69× |
| Same item on a pooled worker | ≈ one handoff | ≈ 109 ns |
| why thread pools exist, in one row | 69× → 0.5× | |
With a fresh thread, the overhead is 69 times the work. With a pooled worker it's about half the work. And as section 2.3 showed, a pool also bounds how many requests are in progress, which often matters more than the speed. A pool of N workers is backpressure you get for free.
7.2What each unit costs to hold and switch
Now the five models side by side, answering the two decisions from section 1. The footprint column is what one waiting request occupies.
| Model | Who switches | Switch cost | Unit footprint |
|---|---|---|---|
| OS threads | Kernel, preemptively | ~1–5 µs | 8 MB virtual stack |
| Event loop | Your code, at each callback | A function call | One callback record |
| Goroutines | Runtime, mostly when one waits | ~100 ns | ~2 KB, growable |
| async / await | Your code, at each await | ~10 ns | Its state machine, often under 100 B |
| Actors | Runtime, per message | A message send | Mailbox plus state |
Resuming an async task is a call into a state machine and needs no kernel. Running an event loop's callback is the same kind of plain function call. A goroutine switch is cheap because it stays in the program. A thread switch pays for entering the kernel, plus the cache and TLB effects from section 2.1.
The Python experiment gives us a way to scale the footprint column up. At the per-unit memory from section 4.2, here is what 100,000 waiting units would hold:
| One waiting thread, resident | 76.8 MB / 2,000 | ≈ 38 KB |
| One waiting asyncio task | 156.7 MB / 100,000 | ≈ 1.6 KB |
| 100,000 threads, at the same rate | 100,000 × 38.4 KB (extrapolated) | ≈ 3.8 GB |
| 100,000 asyncio tasks | measured | 157 MB |
| what the same waiting costs in memory | ≈ 25× less | |
That thread figure is an extrapolation, since the experiment ran 2,000 threads and not 100,000, and a real system would hit the limits from section 2.2 before it got there.
7.3The orders of magnitude
Don't trust any single number here. Trust the spacing between them.
| Operation | Order of magnitude | Source |
|---|---|---|
| Resume an async task | ~10 ns | A call into a state machine; no kernel |
| Goroutine switch | ~100 ns | Go runtime, user space, published benchmarks |
| Thread context switch | ~1–5 µs | Kernel scheduler, plus TLB and cache effects |
| Create an OS thread | ~14 µs | Create and join, from section 7.1 |
| fork + exec a process | ~1 ms | Page tables, loader, dynamic linking |
That's five orders of magnitude from top to bottom. Find the row your workload lands on and the model mostly picks itself.
08Choosing a model
8.1Four questions, in order
With the costs in hand, we can choose. Most decisions are settled by the first two questions.
- How many concurrent units? Under a few thousand, use threads. They're dramatically easier to debug, and preemption means one bad unit can't hang the rest. Above ten thousand you need something stackless or growable.
- Do they mostly wait? I/O-bound work wants async or goroutines. CPU-bound work wants exactly as many OS threads as you have cores, and nothing else helps.
- Do you control the whole dependency tree? One blocking library call poisons an async design (section 4.4).
- Do you need per-unit isolation? Actors give a failure boundary nothing else does. That's worth real overhead in some systems and dead weight in most.
8.2The five side by side
| Model | Best for | Breaks when | Debugging |
|---|---|---|---|
| OS threads | CPU-bound work; under ~1,000 units | A few thousand units: stacks and scheduler cost | Easiest: real stacks, preemption |
| Event loop | Huge numbers of idle connections (nginx, Node.js) | Anything blocks the one thread | Hard: logic split across callbacks |
| async / await | Hundreds of thousands of I/O-bound connections | One blocking call; colouring spreads | Medium: reads like blocking code |
| Goroutines | High concurrency with ordinary blocking code | Memory at very high counts; you inherit a GC | Easy: real stacks, no colouring |
| Actors | Per-unit failure boundaries and supervision | Mailboxes grow without bound under overload | Medium: follow the messages |
8.3Mistakes that look like choices
Cheap concurrency also invites too much of it. go handle(conn) in an accept loop with no limit is the canonical bug. The units are individually cheap, so nothing pushes back, and collectively they aren't. A thread pool had a limit built in, as section 2.3 showed, and the cheaper models lose it.
09Watching it on a real machine
9.1Seeing threads, switches and stalls
Each question this chapter raised has a tool that answers it on a running server. These are for Linux, and $PID is the process id of your server.
# How many threads does the server have, and how big is a new thread's stack? (section 2)
ps -o nlwp= -p $PID            # number of threads in the process
ulimit -s                      # default stack size in KB; 8192 means 8 MB
cat /proc/sys/kernel/threads-max   # the kernel-wide cap on threads

# How often does it switch? (section 2.1)
grep ctxt /proc/$PID/task/*/status   # one pair per thread; voluntary: it blocked, nonvoluntary: it was preempted

# How many connections are open, which sets how many requests could be in flight? (section 1)
ss -tan state established | wc -l      # one extra line for the header

# Is something holding up the event loop? (section 4.4)
# Python:  asyncio.run(main(), debug=True)   logs any step that holds the loop over 0.1 s
# Go:      GODEBUG=schedtrace=1000 ./server  prints the scheduler's state every second
# Tokio:   tokio-console                     shows how long each task runs between awaits
#                                            (the server must include the console-subscriber crate)
Each thread of the process has its own directory under /proc/$PID/task/, which is why the switch counts are read per thread (/proc/$PID/status on its own shows only the main thread's). The two counts tell the threads' story. A high voluntary count means threads are blocking and waking, as a thread-per-request server does all day. A high nonvoluntary count means the kernel is taking the processor from threads that wanted to keep running, which points to more runnable threads than cores.
9.2Rules that hold up
- Count the units before choosing a model, and use threads while the count stays under a few thousand.
- Give CPU-bound work as many OS threads as you have cores. More threads only add switching.
- Never block an async worker. Use
spawn_blocking, a library written for async, or an explicit yield. - Size a pool of blocking workers to the requests you want in flight, which is about 51 per core for our example and not the core count.
- Bound every model, with a semaphore, a bounded channel, a fixed pool or a bounded mailbox.
9.3Symptom, cause, fix
| Symptom | Likely cause | Fix |
|---|---|---|
| Async service stops serving; CPU looks idle | Tasks blocking the worker threads (sync I/O, std::sync::Mutex, long CPU loops) | spawn_blocking, an async-aware library, or explicit yields |
| Memory climbs with load until the process dies | Unbounded spawning, such as go handle(conn) with no limit | A semaphore, bounded channel or fixed pool |
| Thread-per-connection falls over around 10,000 connections | Stack memory, kernel limits and scheduler cost | A pool, or a stackless or growable model |
| Short work items are slow on fresh threads | Thread creation (~14 µs) dwarfs the work | A thread pool |
| An actor's latency keeps growing under load | Its mailbox is growing without bound | Bound the mailbox and shed or push back |
10Summary
- Waiting sets the concurrency you need. At 1 ms of CPU and 50 ms of waiting, one core needs about 51 requests in flight, and serving them one at a time uses about 2% of the CPU.
- Every model answers two questions: what holds a request's place while it waits, and who switches. The kernel preempts threads anywhere; async tasks yield only at
await. - Threads are the easiest to debug, and preemption means one bad unit can't hang the rest. They get painful above a few thousand, and a pool of blocking workers has to be as large as the number of requests in flight.
- An event loop never blocks, so every wait becomes a callback and a request's logic is scattered.
- async/await compiles a function into a state machine with no stack, which makes a million tasks reasonable. In the experiment a waiting task cost about 1.5 KB against about 38 KB for a thread.
- One blocking call can stall every task on an async executor, for as long as the call takes, with the CPU looking idle. The ticker experiment showed a 0.10 s tick arriving at 0.51 s.
- Goroutines are stackful, so ordinary code can block, and there's no function colouring. A goroutine starts at about 2 KB.
- Work stealing keeps workers busy at the price of locality.
- Actors trade a message send per interaction for a failure boundary with supervision.
- Creating a thread costs about 127 round trips through one. Thread pools exist for that reason.
- Count the units before choosing, and bound every model, whichever you pick.
11Build this
Write the echo server three times and find where your curves cross. An echo server sends back whatever each client sends it. This takes an evening and settles the argument with data instead of taste.
- Thread per connection,
std::thread. - A fixed pool of eight with a work queue.
- One thread with
epollorkqueueand a hand-rolled state machine.
Drive all three at 100, 1,000 and 10,000 concurrent connections. Record three numbers. Throughput is how many requests finish each second. p99 latency is the time that 99 out of 100 requests beat. Resident memory is how much the process holds. That third column is the one that decides it, and the one people forget to measure.
Thread-per-connection should do as well as the others at 100 and will probably fail outright at 10,000, though where it gives out depends on your machine's limits. Watching your own machine run out of something is worth more than any table here.
12Interview questions
beginnerWhy can't you just create a hundred thousand OS threads?›
Several limits arrive before the count does. Each thread reserves a stack, 8 MB of virtual address space by default on Linux, so a hundred thousand reserve 800 GB. That memory is committed lazily, so it isn't 800 GB of RAM, but the kernel caps how many threads and mappings a system may have, and each thread uses real memory for the part of its stack it touches and for its kernel record. Scheduler cost also grows with runnable threads, so switching starts eating the CPU you wanted.
intermediateWhat is function colouring and which languages avoid it?›
Once a function is async, its callers must be async or block to call it. The property propagates up the entire call graph, so adding one async function to a library can force every user to restructure.
Go avoids it with stackful goroutines: any function can block and the runtime switches underneath, so there's no distinction to propagate. It pays a growable stack per goroutine. Rust accepted the colouring and got tasks with no stack at all, sized to their state machine.
intermediateYour async service stops serving entirely and CPU looks idle. What happened?›
Something blocked the worker threads. An executor runs roughly one worker per core, so a handful of tasks doing synchronous file I/O, holding a std::sync::Mutex, or running a long CPU loop can take every worker out of service. No task progresses and nothing burns CPU, so it looks like an idle machine that has stopped responding.
Fix it with spawn_blocking, an async-aware library, or an explicit yield inside long loops. The usual culprit is a library call that looks harmless.
deepWhy is a thread pool faster than a thread per work item?›
Creation dominates when items are short. Creating and joining a thread takes about 13.8 µs, against 109 ns for a round trip between two existing ones, about 127 times as much. For a 200 ns work item, creation is 69 times the useful work, and handing the item to a pooled worker costs roughly one handoff instead.
Pools also bound concurrency, which often matters more than the speed. A pool of N workers is backpressure you get for free.
deepWork stealing improves utilisation. What does it cost?›
Locality. Your task can resume on a different core than it suspended on, so anything warm in that core's cache is gone and assumptions that code stays on one thread break. For short tasks the steal can cost more than the work it enabled.
Go and Tokio soften this by taking about half of the victim's queue in a single steal, so the cost is paid once for many tasks. Other designs, such as Cilk and Java's ForkJoinPool, steal from the opposite end of the victim's queue to the one the victim uses, so the victim keeps working on its own end without synchronisation. Where you can't tolerate migration there's runtime.LockOSThread in Go and spawn_local in Tokio.
13Go deeper
Threads, goroutines, async tasks, actors: which unit has no stack at all?›
An async task. The compiler turns the function into a state machine struct sized to the variables live across await points, often under 100 bytes.
You call a blocking C library from a goroutine. What happens?›
Go's runtime notices the blocked OS thread and spins up another to keep other goroutines running. It survives, unlike a stackless executor, and that's why Go tolerates cgo where Tokio would stall.
Your work items take 500 ns. Spawn a thread each?›
No. Creation takes about 14 µs, roughly 28 times the work. Use a pool.
You have 200 concurrent connections. Is async the right call?›
Probably not. Async buys per-unit memory, and at 200 units that isn't your problem. You'd pay function colouring across your API for nothing.
Concurrency: an introduction to threads, and event-based concurrency, which builds the event loop up step by step and shows why a blocking call is so costly in it. Free online at ostep.org.
A 1999 page asking how one server handles ten thousand simultaneous connections. It's why epoll and kqueue exist, and the thread-per-connection failure in the Build this exercise is exactly what it described.
Short, funny, and the 2015 essay everyone cites when arguing about async. Go answered with stackful goroutines; Rust accepted the colouring and got stackless tasks.
Dmitry Vyukov's original notes. Clearest account of work stealing and why goroutines yield where they do.
The scheduler write-up covers the multi-threaded work-stealing design and the starvation cases it guards against.
14Related chapters
The kernel scheduler that switches OS threads, and what a context switch costs. Chapter 06.
Where epoll comes from, the call every event loop and async executor
blocks in. Chapter 07.
What happens when the units in any of these models share state. Chapter 13.
Little's Law and the utilisation curve, for sizing the pools and bounds this chapter recommends. Chapter 16.