Suppose a server has gone slow and you suspect that something on it is opening files at a ridiculous rate. You type one line into a terminal, wait two seconds, and get a small table: every program's name, and how many times it asked to open a file in those two seconds. None of the programs you were watching had to be restarted or rebuilt, and the server never stopped serving.
The counting happened somewhere you might not expect. Every request to open a file goes through the kernel, the core of the operating system and the one part of the machine that can touch everything: all of memory, every device, every other program. To see every file open on the machine, your counter had to be there when the kernel handled each one. So that one line put a small program of yours inside the kernel. That should sound alarming. An ordinary program that makes a mistake crashes alone, but the kernel has nothing underneath it to catch a mistake, and a single bad pointer or a loop that never ends can stop the whole machine.
Linux allows it through a system called eBPF. The kernel accepts only small programs written in a restricted form, examines each one before it runs, and refuses any it can't prove safe. This chapter asks one question: how can the kernel run a program you hand it, while it's running, and still be sure that program can't crash it? We'll start with the counter and see what the kernel does with it, then grow it into a filter that reads network packets, which is where the checking gets difficult, and finish with what it costs every time it fires and what "safe" still leaves out.
01A counter in the kernel
1.1Running one line
Let's do it first. The experiment needs a Linux kernel. On a Mac or Windows laptop, Docker Desktop provides one: it runs a small Linux virtual machine (built with LinuxKit), and every container shares that machine's kernel. You need Docker and about a minute for the install inside the container.
The command below does four things. docker run --rm --privileged ubuntu:24.04 starts a throwaway Ubuntu container (--rm deletes it afterwards), and --privileged gives it the right to load programs into the kernel, which an ordinary container isn't allowed to do. Inside it, apt-get install bpftrace installs bpftrace, a tool that turns a one-line description into a kernel program, and mount -t tracefs none /sys/kernel/tracing makes the kernel's tracing files visible, because bpftrace uses them to find where to attach. The last command is the one we care about, and it has three parts:
tracepoint:syscalls:sys_enter_openatnames a moment: the instant any process begins anopenatcall. A system call (syscall) is how a program asks the kernel to do something it can't do itself, andopenatis the one for opening a file. Chapter 07 covers how a syscall works.{ @[comm] = count(); }says what to do at that moment.commis the name of the process making the call,@[comm]is a table indexed by that name, andcount()adds one to that name's row.interval:s:2 { exit(); }says to stop after two seconds, at which point bpftrace prints its tables.
If you have a Linux machine where you can use root, you can skip Docker: install bpftrace and run the bpftrace -e part with sudo.
docker run --rm --privileged ubuntu:24.04 sh -c '
  apt-get update -qq && apt-get install -y -qq bpftrace
  mount -t tracefs none /sys/kernel/tracing
  bpftrace -e "tracepoint:syscalls:sys_enter_openat { @[comm] = count(); }
interval:s:2 { exit(); }"'Attaching 2 probes...
@[bpftrace]: 1
@[dockerd]: 2
@[init]: 2
@[containerd]: 15
@[containerd-shim]: 42The lines after Attaching 2 probes... are the table the program built while it ran: for each process name, how many times it called openat in two seconds, with the smallest count first. (The two probes are the two blocks in the command, the counter and the timer.) In this run the container runtime's shim opened files 42 times, containerd 15 times, and bpftrace itself once. Your table will list different processes and counts, and bpftrace itself will usually be in it.
1.2What the kernel did with the line
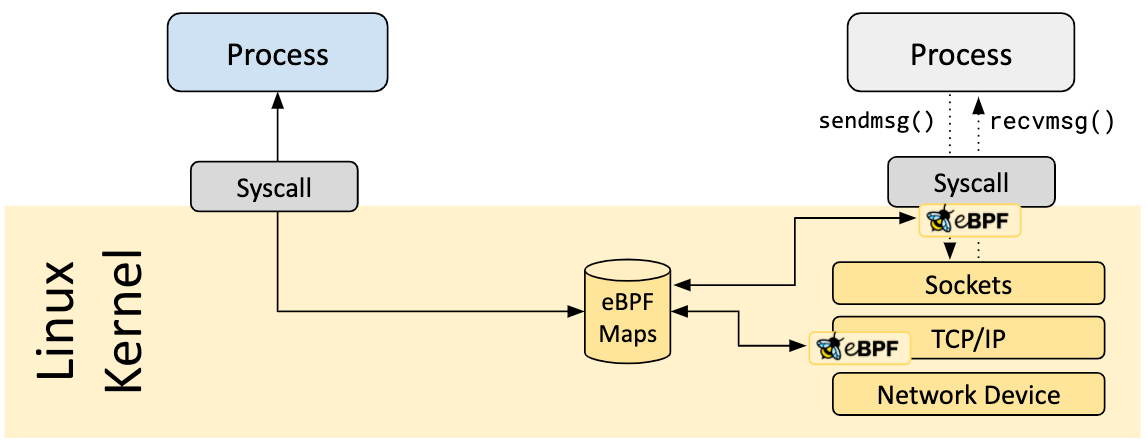
That single line became a small program, and it has three pieces. We'll use their names for the rest of the chapter. The program is the logic that runs: find the name of the calling process, add one to its row. The hook is the moment the kernel runs it, here the start of every openat. The map is the table the program updates. It lives in kernel memory, so its contents survive from one openat to the next, and bpftrace can read it from outside when the two seconds are up.
Your shell, your editor and containerd are ordinary programs, and they run in a walled-off area the kernel gives them, called user space. A program in user space can't touch the kernel's memory, so to open a file it has to make a syscall and wait for the kernel to do it. Here is one openat call, followed from the process that makes it to the table you saw:
containerd-shim is about to open a file, so it makes an openat call. The counter program is already loaded and attached to the hook at the start of openat. The map holds each name's count so far.The program added one to a table and returned. It never changed what openat did, and the process that made the call never knew. You didn't rebuild the kernel or reboot it, and no other program on the machine paused.
What makes this surprising is where the program ran. It ran inside the kernel, the one place on the machine where a mistake can't be caught, and the kernel had never seen this program before you typed it. So why did the kernel let it in?
02Why the kernel can't just run your code
2.1Two ways in, and what's wrong with each
Think about what protects you when an ordinary program goes wrong. If it follows a bad pointer, the kernel notices and stops that one program (you've seen this as a segmentation fault), and everything else carries on. Code running inside the kernel has no such protection. It can read or overwrite any memory on the machine, and a loop that never ends takes that CPU away from every other program. A bug there stops the whole machine, which is called a kernel panic.
So for a long time there were two ways to get new behaviour into a running Linux kernel, and each had a serious drawback. The third row of the table is what we'd like.
| Option | How it works | Problem |
|---|---|---|
| Patch and rebuild | Add a print statement to the kernel source, rebuild, reboot | Nobody does that on a production box to answer one question |
| Kernel module | Your own code, loaded into the running kernel with full privilege | Fast and flexible, and one bad pointer crashes the whole machine |
| eBPF | A restricted kind of program, proven safe before it runs, then compiled to machine code | Only what the kernel can prove |
What we want is a small piece of our own code, loaded into the running kernel, run whenever some event happens, and certain not to bring the machine down. The word "certain" is the hard part. We can't just trust whoever wrote the program, and we can't test it against every possible input in advance.
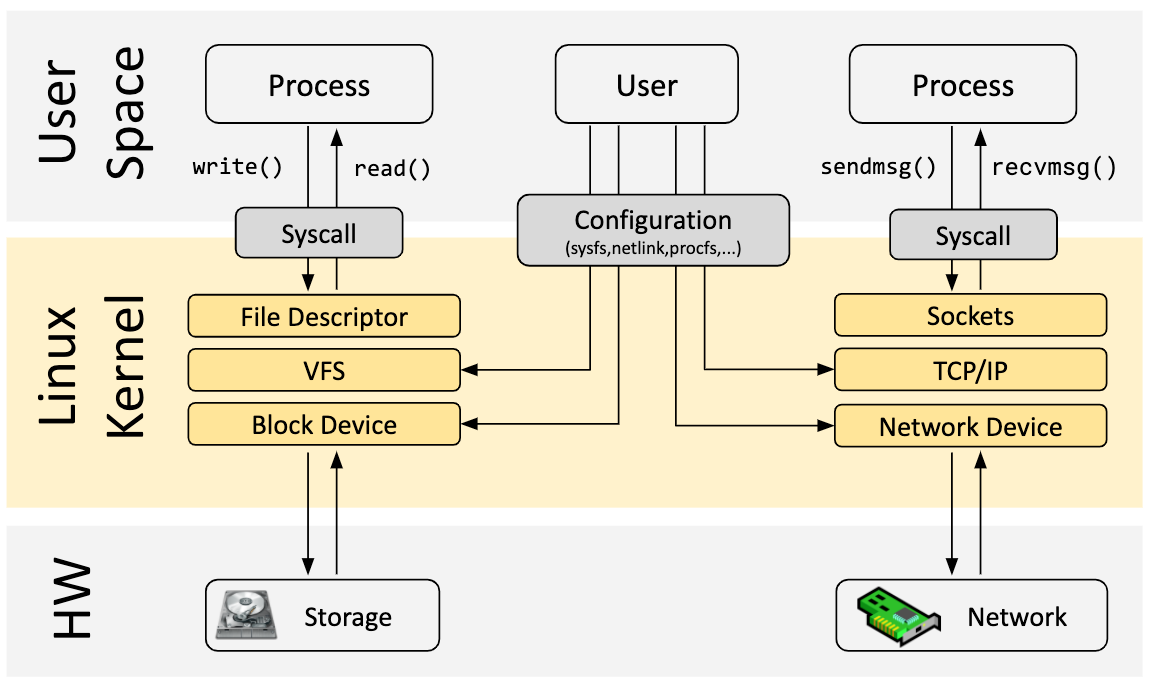
?How can that be possible?
The way out is for the kernel never to take your machine code on trust. Instead it accepts a small, restricted set of instructions, a bytecode: the instructions of a simple imaginary processor that no real CPU runs directly. Before running anything, the kernel reads those instructions as data and works out, instruction by instruction, whether the program could misbehave. Every memory access has to be to something the program is allowed to touch, and every path through the program has to end. If the kernel can't prove both, it refuses to load the program. That checker is called the verifier. The proof is feasible because the instruction set is small and restricted enough for the kernel to reason about all of it.
2.2Verifier, JIT, hooks and maps
With the counter in mind, each part of that arrangement is easy to place. Four pieces make up the system, two of which you've already met:
| Piece | What it does |
|---|---|
| Verifier | The kernel's checker. It proves the program safe at load time, in kernel/bpf/verifier.c |
| JIT | A "just-in-time" compiler. It turns a program the verifier accepted into real machine code once, at load time, so it runs at native speed |
| Hook | A place in the kernel where the program gets called: a syscall's entry, the start of any kernel function, a packet arriving at a network card |
| Map | A table shared between the program and user space, like the per-name counts our counter kept until bpftrace printed them |
Notice when the checking happens: once, when the program is loaded, and not each time it runs. That's why running the counter costs so little. The safety work is already done by the time the first openat arrives.
?Can the verifier prove every path ends?
In general, no. Deciding whether an arbitrary program halts is the halting problem, and no checker can answer it for every program. So the verifier takes the cautious route: it accepts a program only if it can show the program ends, and refuses everything else, including some programs that would have been fine. For years it refused any loop at all. Since Linux 5.3 it accepts loops it can show are bounded, by following the program's paths one step at a time, and it gives up at a million steps. That limit is where most people spend their first afternoon with eBPF, and section 5.4 counts the steps on a real loop.
So the bargain is: pass the verifier and you're in. What does passing promise, and what does it leave out?
03What the check promises, and what it leaves out
Our counter went through exactly that sequence: handed over as bytecode, checked, compiled, then called at every openat. The same is true of any eBPF program, whatever its hook. Passing the check earns a program a promise from the kernel, and the promise is narrower than "this program is fine", so it's worth stating exactly.
3.1Four promises
| Promise | What it means |
|---|---|
| It won't touch memory it wasn't given | Every read or write through a pointer is proven in bounds before the program ever runs, so nothing needs checking while it runs |
| It will terminate | Every path through the program reaches exit within a bounded number of steps |
| It only calls what it's allowed to | Each program type gets a fixed list of helper functions (functions the kernel offers to programs) and kernel functions, and nothing else |
| Types line up | Using a packet pointer where a map value is expected, or leaking a kernel address into a map that a user without root can read, is rejected at load |
All four protect the same two things, the kernel's memory and its ability to keep running, and all four are checked once, at load time. Our counter passes easily, because all it does is fetch a name and update its own table. Programs that read memory they didn't create, such as network packets, give the verifier real work, and section 5 follows one.
3.2What 'safe' doesn't mean
Two more things fall outside the contract. One is bugs in the verifier itself: it's roughly 21,800 lines of C in 6.10, and when its reasoning about bounds is wrong it accepts a program that can read and write kernel memory. The other is bugs in the kernel code a program calls. Section 6 has both.
The promises are about memory accesses, paths and calls, so the verifier can't be reading the C or the bpftrace line you wrote. It reads something lower-level and more detailed. To see what, we need to know what a program is made of.
04What a program is made of
4.1Instructions and registers
What the verifier reads is bytecode. Every eBPF instruction is eight bytes long, laid out as in this struct, which has been the same since 2014:
struct bpf_insn {
	__u8	code;		/* opcode */
	__u8	dst_reg:4;	/* dest register */
	__u8	src_reg:4;	/* source register */
	__s16	off;		/* signed offset */
	__s32	imm;		/* signed immediate constant */
};
An instruction says what to do (code), which registers to work on, and carries a small offset and a constant. A register is one of a handful of named storage slots inside a processor, and instructions mostly take their inputs from registers and leave their results in registers. The register fields are four bits wide, so there can be at most 16 registers, and eBPF uses 11.
The set of registers is small and deliberately shaped like the CPUs it gets compiled for. Two words in the table need explaining. The context is a structure that describes the event that fired the program: for a network packet program it holds the addresses where the packet starts and ends, and for a kprobe it holds the CPU's registers at the moment of the call. A helper is a function the kernel provides for programs to call, such as the one that looks up a map entry.
| Register | Role |
|---|---|
| r0 | Return values, from helpers and from the program itself |
| r1–r5 | Arguments. On entry r1 is the context pointer: an xdp_md for XDP, pt_regs for a kprobe. |
| r6–r9 | Keep their value across a helper call, so a program can park something there |
| r10 | Read-only pointer to the program's stack: 512 bytes of scratch space for local variables |
That 512 is MAX_BPF_STACK in include/linux/filter.h, and it's the limit people hit when they put a 600-byte struct on the stack.
All eleven registers are 64 bits wide, with 32-bit operations available on their lower halves. They map one to one onto x86-64 and arm64 registers, so the JIT can stay simple. Since October 2024 the instruction set has been an IETF standard, RFC 9669.
4.2Maps: the only state that outlives one call
A program runs for one event and returns, and its registers and stack disappear with it. The counter needs its count to survive until the next openat, so anything a program wants to remember, count or hand to user space goes in a map: a table owned by the kernel, with a file descriptor, created before the program loads. (Strictly, a program's global variables are maps too, created behind your back by a loader library called libbpf.)
Maps come in several shapes, and the choice matters for speed:
| Map type | Shape | Where you meet it |
|---|---|---|
| HASH | Key to value, preallocated buckets | Connection tables, per-PID state |
| ARRAY | Integer index to value, fixed size, never deleted | Config, counters, the verifier inlines lookups |
| PERCPU_HASH / PERCPU_ARRAY | One value slot per CPU per key | Counters with no atomics: the drop counter in section 5 |
| LRU_HASH | Hash that evicts least-recently-used entries when full | Flow tables in Cilium and Katran that must not fill up |
| RINGBUF (5.8) | One ring buffer shared by all CPUs, mapped into user space | Event streams: Falco's modern probe, Tetragon |
| PROG_ARRAY | Array of programs, for tail calls (one program handing control to another) | Chaining programs past the size limit |
?Why per-CPU?
A counter that every CPU increments needs an atomic add, an instruction that stays correct when two CPUs update the same memory at once. To do that, the CPUs have to take turns on the cache line, the chunk of memory holding the counter, so at millions of packets a second the line bounces between cores, as chapter 13 describes. With a slot for each CPU, the increment is a plain load, add and store, because nobody else touches that slot, and user space adds the slots up when it reads.
4.3Program types and attach points
A map holds what a program remembers. Two more things decide how a program behaves. Its type decides what its context looks like, which helpers it can call and what its return value means. Its attach point decides when it runs. A 6.10 kernel's bpftool feature probe listed 32 program types as available (everything except lirc_mode2). These are the ones a working engineer meets:
| Hook | Fires on | Stable? | Typical user |
|---|---|---|---|
| kprobe / kretprobe | Entry or return of almost any function inside the kernel | No, internal functions change | bpftrace, BCC (an earlier tracing toolkit) |
| tracepoint / raw_tp | A marker the kernel developers placed in the code on purpose | Yes, treated as an interface programs can rely on | Syscall and scheduler tracing |
| fentry / fexit (5.5) | Entry or exit of a kernel function, through a small generated stub (a BPF trampoline) | No, same as kprobe | Modern tracers, Tetragon |
| uprobe / uretprobe | An instruction inside a user-space program or library | Depends on the binary | Tracing TLS libraries, runtimes |
| XDP | A packet that just reached the network driver, before the kernel has built its usual per-packet record, the sk_buff | Yes | Cloudflare, Katran, Cilium |
| tc (sched_cls) | A packet entering or leaving, after the sk_buff exists | Yes | Cilium datapath, egress policy |
| cgroup/* | Socket operations, device access, connect() and sysctl for a cgroup, a group of processes the kernel tracks together, such as a container | Yes | systemd, Cilium socket LB |
| LSM (5.7) | The kernel's security checkpoints (Linux Security Modules): opening a file, running a program, mapping memory | Yes | Tetragon, KRSI-style policy |
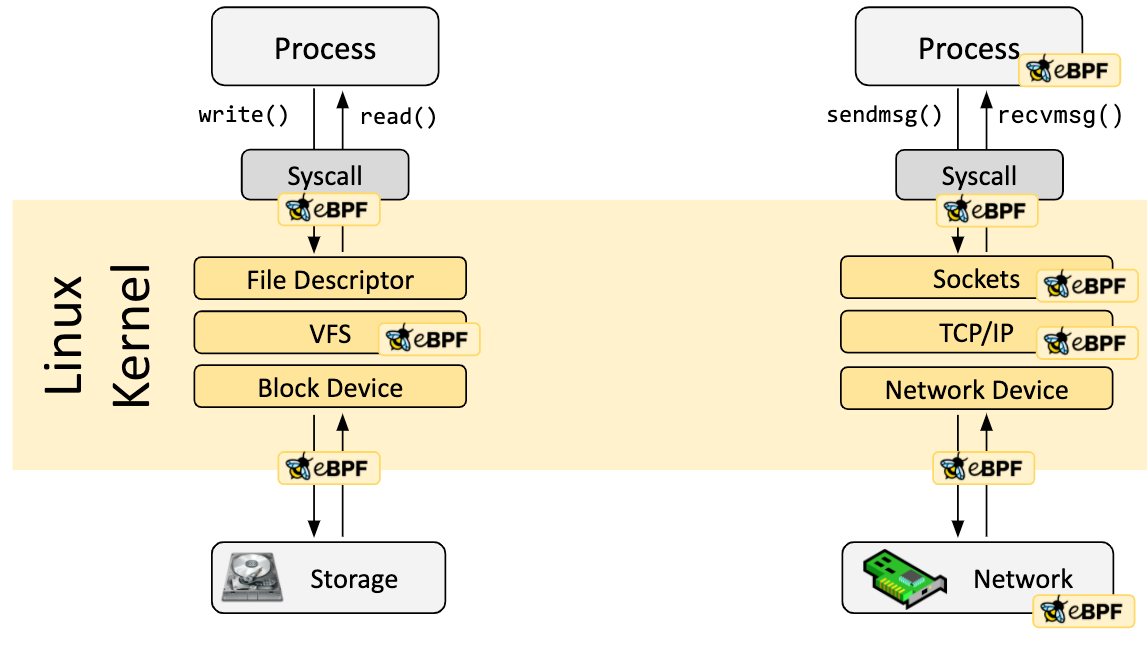
"Unstable" is meant literally. A kprobe on tcp_v4_connect works until a release inlines or renames that function, and then your tool attaches to nothing. BTF and CO-RE (section 5.6) partly solve that.
Our counter touched nothing but its own map, so it never stretched the verifier. A packet filter does, because it reads bytes that come from outside and whose length it can't know in advance. We'll build one that drops UDP packets to port 9999 and follow it from source file to running hook.
05From C source to a dropped packet
5.1The program and its journey
Here is the counter grown into a packet filter. It needs three ideas first. A packet reaching a machine goes through the network card (NIC), which copies the bytes into memory, and then through the driver, the kernel's code for that card. XDP (eXpress Data Path) lets an eBPF program run right there in the driver, on the raw bytes, and return a verdict: XDP_DROP to throw the packet away, or XDP_PASS to let it continue into the normal network stack (chapter 10). The program's context is an xdp_md holding two pointers, data, where the packet starts, and data_end, one byte past its last byte.
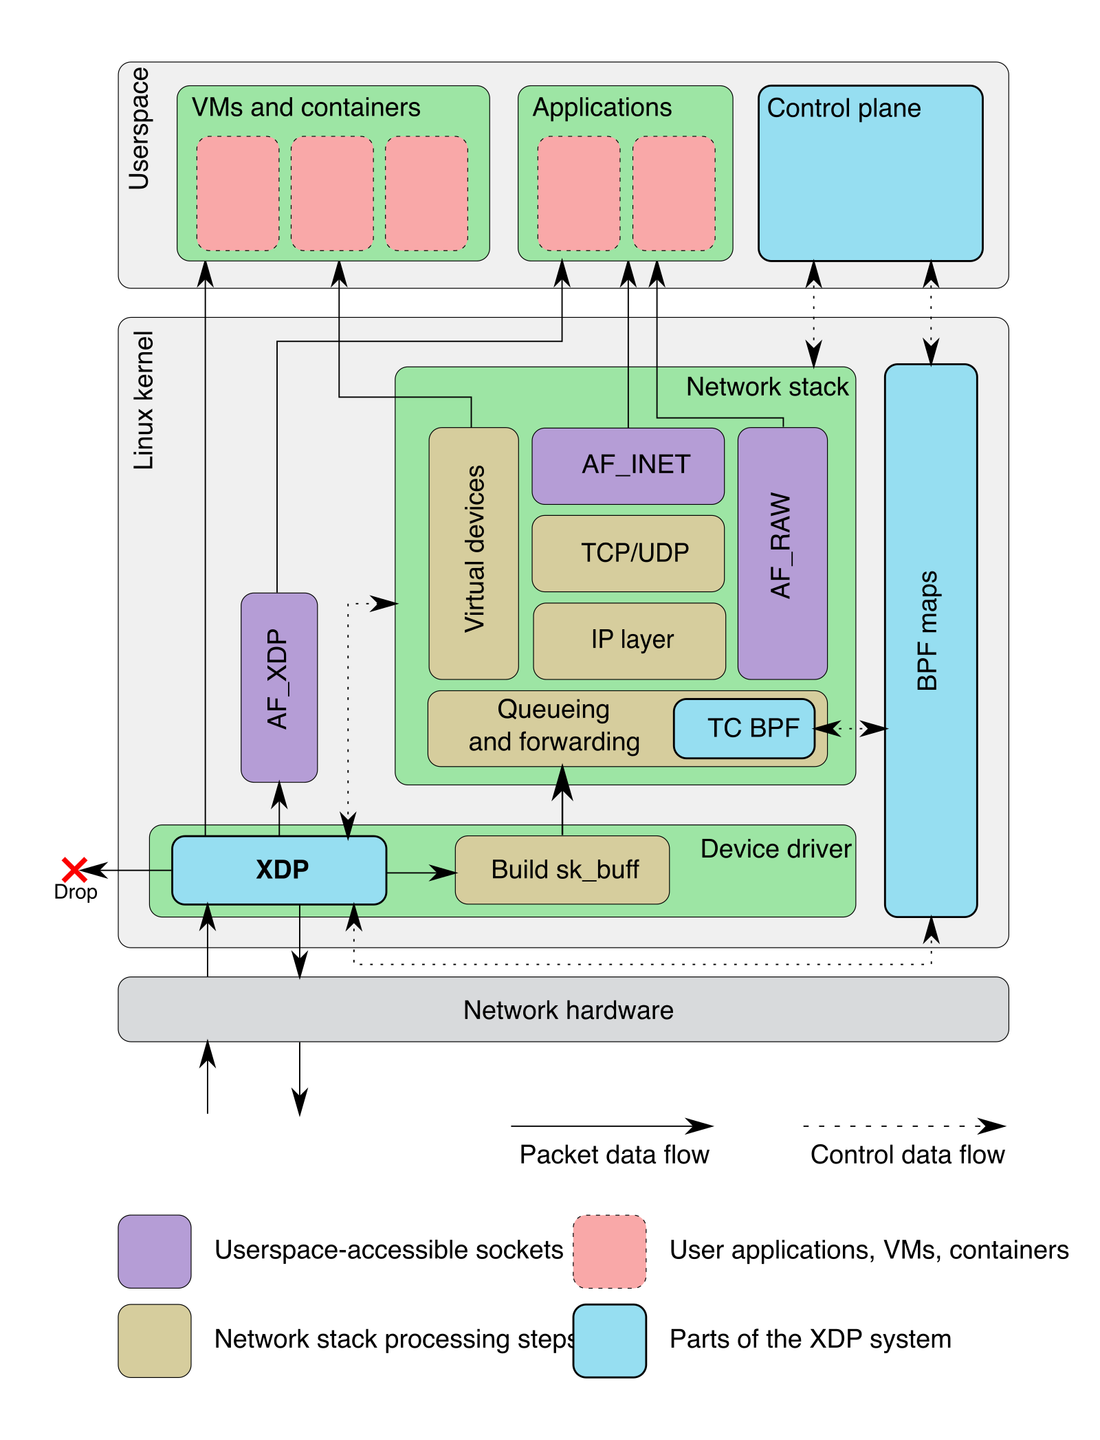
The second idea is that a packet is a stack of headers followed by a payload: an Ethernet header (14 bytes), then an IP header, then a UDP header, which holds the destination port. To read the port, the program steps past each header in turn. That's where the danger is, because the sender decides how long the packet is, and it may be shorter than a header. Reading past data_end would read memory that belongs to something else. So the program checks before every read. Each if (... > data_end) return XDP_PASS below means "too short to hold this header, so leave the packet alone". When a packet is UDP and addressed to port 9999, the program adds one to a per-CPU counter in a map called drops, and drops it.
SEC("xdp")
int xdp_drop_9999(struct xdp_md *ctx)
{
    void *data     = (void *)(long)ctx->data;
    void *data_end = (void *)(long)ctx->data_end;

    struct ethhdr *eth = data;
    if ((void *)(eth + 1) > data_end)          /* the check the verifier wants */
        return XDP_PASS;
    if (eth->h_proto != bpf_htons(ETH_P_IP))
        return XDP_PASS;

    struct iphdr *ip = (void *)(eth + 1);
    if ((void *)(ip + 1) > data_end || ip->protocol != IPPROTO_UDP)
        return XDP_PASS;

    struct udphdr *udp = (void *)ip + ip->ihl * 4;
    if ((void *)(udp + 1) > data_end)
        return XDP_PASS;

    if (udp->dest == bpf_htons(9999)) {
        __u32 key = 0;
        __u64 *n = bpf_map_lookup_elem(&drops, &key);   /* PERCPU_ARRAY */
        if (n)
            (*n)++;
        return XDP_DROP;
    }
    return XDP_PASS;
}
SEC("xdp") labels the function as an XDP program, so libbpf knows its type (section 4.3). bpf_htons converts a number into the byte order used on the wire, so that 9999 compares correctly with the port inside the packet. The program is short enough to read, and it trips over every part of the verifier that matters. First, its journey from a file to a program that fires. The C is compiled by clang into eBPF bytecode, stored in an ELF object file, the standard format for compiled code on Linux. A user-space library, libbpf, creates the maps the program uses and then loads it by calling the bpf() system call with the command BPF_PROG_LOAD. The verifier checks it, the kernel rewrites some instructions, and the JIT compiles the result. But loading is not running: something still has to attach the program to a hook.
Sections 5.2 to 5.4 look inside the verifier step, section 5.5 at the rewrite and the JIT, and section 5.7 at the attach.
5.2The verifier walks every path
Think of the verifier as an abstract interpreter. It doesn't run your program on real data. It runs it on descriptions of data, and for every register at every instruction it keeps a state:
| State | What it tracks |
|---|---|
| Type | ctx (the context pointer), pkt (a pointer into packet data), pkt_end, map_value_or_null, scalar (a plain number, not a pointer), and more than a dozen others |
| Bounds | For scalars: unsigned and signed minimum and maximum, tracked separately for the 64-bit value and its low 32 bits, plus a tnum, a bit-level mask of which bits are known |
| Range | For packet pointers: how many bytes past this pointer have been proven to lie before data_end |
The range is the number the drop program lives or dies by, and the log calls it r. At a conditional jump the verifier doesn't pick a side. It pushes one branch onto a stack of paths still to walk, narrows each register's state for the branch it's following ("if r1 > r2 was false, then r1 is at most r2"), and comes back for the other branch later. Here's that walk over the drop program:
data pointer starts as a packet pointer with zero bytes proven to exist, so reading the Ethernet type field (byte 12) now would be refused.Here's the main loop at v6.10, including the check behind the failure we'll meet in section 5.4:
static int do_check(struct bpf_verifier_env *env)
{
	...
	for (;;) {
		...
		insn = &insns[env->insn_idx];
		class = BPF_CLASS(insn->code);

		if (++env->insn_processed > BPF_COMPLEXITY_LIMIT_INSNS) {
			verbose(env,
				"BPF program is too large. Processed %d insn\n",
				env->insn_processed);
			return -E2BIG;
		}

		state->last_insn_idx = env->prev_insn_idx;

		if (is_prune_point(env, env->insn_idx)) {
			err = is_state_visited(env, env->insn_idx);
			if (err < 0)
				return err;
			if (err == 1) {
				/* found equivalent state, can prune the search */
				...
				goto process_bpf_exit;
			}
		}
Two things in those lines explain most verifier behaviour:
insn_processedcounts steps of the walk, not instructions in the program. A loop body is counted once per iteration the verifier simulates.BPF_COMPLEXITY_LIMIT_INSNSis 1,000,000, defined ininclude/linux/bpf.hwith the comment/* yes. 1M insns */.- Pruning is the only thing that keeps this tractable. At certain instructions, called prune points,
is_state_visitedcompares the current register and stack state against states it already proved safe at that instruction. If the current one is a subset (every range inside an old range), this path is safe by the old proof and the walk stops here.
The walk needs a first piece of evidence to start from, and the only evidence it accepts is a comparison in the program. What happens when the program doesn't supply one?
5.3Bounds tracking, and the error everyone hits first
To see the packet range at work, take the version everybody writes first: read the Ethernet type field without checking that the packet is long enough. Here's the log, verbatim, from bpftool prog load on the 6.10 kernel:
0: R1=ctx() R10=fp0
; struct ethhdr *eth = (void *)(long)ctx->data; @ xdp_bad.c:9
0: (61) r1 = *(u32 *)(r1 +0)          ; R1_w=pkt(r=0)
; if (eth->h_proto == 0x0008)        /* htons(ETH_P_IP) on little-endian */ @ xdp_bad.c:10
1: (71) r2 = *(u8 *)(r1 +12)
invalid access to packet, off=12 size=1, R1(id=0,off=12,r=0)
R1 offset is outside of the packet
processed 2 insns (limit 1000000) max_states_per_insn 0 total_states 0 peak_states 0 mark_read 0
Read R1_w=pkt(r=0) as "r1 is a packet pointer, and zero bytes past it are known to exist". Reading byte 12 needs r of at least 13, so the load is refused. In the working version, the if ((void *)(eth + 1) > data_end) comparison is what raises r to 14 on the fall-through branch, as in the third frame of the animation above. The verifier learns from your if statements and from nothing else.
?Why does this error confuse people?
Because the fix isn't on the line the log points at. It's a comparison you add before it, in the form the verifier pattern-matches: pointer plus constant, compared against data_end.
Once packet reads are safe, the other half of the contract is that every path ends. That's where the million-step limit from section 2 bites.
5.4What pruning costs: a loop, counted
To put a number on "steps, not instructions", one loop was compiled with different bounds. Its body is eight eBPF instructions and the whole program is thirteen:
#pragma clang loop unroll(disable)
for (__u32 i = 0; i < N; i++)
    sum += i * i;
The pragma tells clang not to unroll the loop, so it stays a loop in the bytecode instead of being pasted out N times. Before you read the table, a question:
That 13-instruction program, with N = 130,000. Does it load?
| N | Program size | Steps the verifier took | Result |
|---|---|---|---|
| 1,000 | 2 instructions | – | Loaded. Clang folded the whole loop into a constant. |
| 100,000 | 13 instructions | 800,005 | Loaded in 0.07 s |
| 120,000 | 13 instructions | 960,005 | Loaded |
| 130,000 | 13 instructions | limit | BPF program is too large. Processed 1000001 insn |
| 400,000 | 13 instructions | limit | Rejected after 1.9 s |
The step count comes from bpf_prog_info, which the kernel has reported since 5.16. For both loaded runs it's exactly 8 × N + 5.
?Why didn't pruning help?
Because i is a known constant on each pass, no two states match, and nothing prunes. Every iteration got simulated. So this body's ceiling is N = 124,999, and program length has nothing to do with it.
Before 5.3 none of this loaded at all. A control-flow check rejected any back-edge with back-edge from insn %d to %d, and people unrolled loops (made the compiler paste the loop body out N times) with #pragma unroll. Alexei Starovoitov's bounded loops series lifted that for 5.3 by letting the walk go round the loop and trusting the complexity limit to stop it.
The one-million complexity limit, and the end of the 4,096-instruction cap on program size for privileged programs, arrived in 5.2 with commit c04c0d2b968a. Its message says "on typical x86 machine non-debug kernel processes 1M instructions in 1/10 of a second". On a small arm64 virtual machine, reaching the limit took 1.9 to 3.7 seconds. How much of that gap is arm64, how much is the kernel build and how much is other load on the host hasn't been separated.
A program that passes the walk still isn't run as you wrote it.
5.5The rewrite, then the JIT
After the verifier accepts a program, the kernel rewrites it, and bpftool prog dump xlated shows the result. Two rewrites are visible in the drop program. Clang emitted this for the first two loads:
1:  r2 = *(u32 *)(r1 + 0x4)      ; ctx->data_end, as a u32 in struct xdp_md
2:  r3 = *(u32 *)(r1 + 0x0)      ; ctx->data
The kernel runs this instead:
; void *data_end = (void *)(long)ctx->data_end;
   1: (79) r2 = *(u64 *)(r1 +8)
; void *data     = (void *)(long)ctx->data;
   2: (79) r3 = *(u64 *)(r1 +0)
struct xdp_md is a stable view with 32-bit fields, and it exists for your convenience. Underneath is the kernel's own xdp_buff, holding 64-bit pointers, and each context access gets rewritten to the real field. The second rewrite is the map lookup: the bpf_map_lookup_elem call on a per-CPU array became eleven inline instructions with a bounds check against max_entries, and no call at all.
Then the JIT turns that into arm64 machine code: 336 bytes for the whole program. bpftool needs a build with LLVM or libbfd to show JIT output (the one in Ubuntu's linux-tools package isn't), but the image can also be read out with bpf_obj_get_info_by_fd and disassembled with objdump -b binary -m aarch64. Here's the middle of it. The first lines load data_end and data, add 14 (0xe, the Ethernet header) to data, compare, and branch away if the packet is too short:
  40:  f9400401   ldr   x1, [x0, #8]        ; data_end
  44:  f9400002   ldr   x2, [x0]            ; data
  4c:  91003800   add   x0, x0, #0xe        ; eth + 1
  50:  eb01001f   cmp   x0, x1
  54:  54000648   b.hi  0x11c               ; too short: XDP_PASS
  ...
  e8:  d37df0e7   lsl   x7, x7, #3
  ec:  8b0000e7   add   x7, x7, x0
  f0:  f94000e7   ldr   x7, [x7]
  f4:  d538d08a   mrs   x10, tpidr_el1      ; this CPU's per-CPU offset
  f8:  8b0a00e7   add   x7, x7, x10
 10c:  f94000e0   ldr   x0, [x7]
 110:  91000400   add   x0, x0, #0x1        ; (*n)++, no atomic
 114:  f90000e0   str   x0, [x7]
The later lines find this CPU's slot of the per-CPU counter and increment it. It's roughly what you'd write by hand. Each bounds check is one compare and a branch. Finding the per-CPU counter is a read of tpidr_el1, which holds this CPU's offset for per-CPU data, and an add, and the increment is a plain add and store with no atomic.
?Why bother with a JIT when the kernel has an interpreter?
An interpreter reads bytecode and carries out each instruction itself, in software, working out what to do every time. A JIT does that work once, up front, and leaves the CPU with plain machine code. To get a feel for the gap, here's a 40-line eBPF interpreter. It uses the real instruction layout and opcode bytes, and it times a small loop twice: once as eBPF bytecode through the interpreter, and once as the same loop written in C and compiled to machine code. The loop adds r1 into r0 and counts r1 up to a hundred million, so the interpreter executes three instructions per pass.
struct bpf_insn {
    uint8_t code;
    uint8_t dst_reg : 4;
    uint8_t src_reg : 4;
    int16_t off;
    int32_t imm;
};
static_assert(sizeof(bpf_insn) == 8);

enum : uint8_t {  // real opcode bytes: class | op | source
    MOV64_K = 0xb7, ADD64_K = 0x07, ADD64_X = 0x0f, JLT_K = 0xa5, EXIT = 0x95,
};

uint64_t run(const bpf_insn* pc, uint64_t* insns_executed) {
    uint64_t r[11] = {}, n = 0;
    for (;; ++pc, ++n) {
        switch (pc->code) {
        case MOV64_K: r[pc->dst_reg] = (int64_t)pc->imm; break;
        case ADD64_K: r[pc->dst_reg] += (int64_t)pc->imm; break;
        case ADD64_X: r[pc->dst_reg] += r[pc->src_reg]; break;
        case JLT_K:   if (r[pc->dst_reg] < (uint64_t)pc->imm) pc += pc->off; break;
        case EXIT:    *insns_executed = n + 1; return r[0];
        }
    }
}

// r0 = 0; r1 = 0; loop: r0 += r1; r1 += 1; if r1 < N goto loop; exit
const bpf_insn prog[] = {
    {MOV64_K, 0, 0, 0, 0}, {MOV64_K, 1, 0, 0, 0},
    {ADD64_X, 0, 1, 0, 0}, {ADD64_K, 1, 0, 0, 1},
    {JLT_K, 1, 0, -3, 100'000'000}, {EXIT, 0, 0, 0, 0},
};
// ...timed with steady_clock against the same loop in C, with an
// asm volatile barrier so clang can't turn it into n*(n-1)/2.result 4999999950000000, 300000003 BPF insns executed
interpreted: 0.91 ns per BPF insn
native: 0.08 ns per loop-equivalent insn
ratio: 10.9xThe sum is right (adding 0 through 99,999,999 gives 4,999,999,950,000,000), and the interpreter executed 300,000,003 instructions to get it: two to set up, three per pass, one to exit. Each interpreted instruction took about 0.91 ns, and the native loop about 0.08 ns per equivalent instruction, a ratio of about 11. Across three runs the ratio was 10.9×, 9.1× and 10.7×. Linux's interpreter uses a computed-goto jump table, which beats the switch used here, but it still has a dispatch branch per instruction against roughly one cycle per instruction for native code.
Kernels built with CONFIG_BPF_JIT_ALWAYS_ON=y, which includes the 6.10 kernel used for the other measurements, remove the interpreter from the build, so there's no choice to make. That option came in early 2018, during the scramble to fix Spectre, a family of CPU flaws in which the processor's guesses about upcoming code leave traces of secret memory behind. An in-kernel interpreter that executes attacker-supplied bytecode is a very convenient Spectre v1 gadget, a piece of code an attacker can use to trick the CPU's speculation into leaking memory (chapter 44).
The drop program reads packet headers, whose layout is fixed by the network standards. A program that reads the kernel's own structures has a harder problem.
5.6BTF and CO-RE: one binary, many kernels
A tracing program wants to read task->mm->exe_file or sk->__sk_common.skc_daddr. Those offsets change between kernel versions and distribution configs, so an offset compiled in for one kernel reads garbage on another.
?Why not just compile on each host?
That was the answer of BCC, the BPF Compiler Collection, an early toolkit of tracing tools: ship clang and the kernel headers to every host and compile at startup. It's a large dependency, and it costs seconds of CPU on every node whenever the agent starts.
BTF is the fix on the kernel side. It's a compact description of the types of the running kernel, built into it; on a 6.10 linuxkit kernel /sys/kernel/btf/vmlinux is 6.2 MB and describes every struct. CO-RE ("compile once, run everywhere") is the fix on the program side. Here is one field access, from compile to load:
__builtin_preserve_access_index (or BPF_CORE_READ) into a relocation that names the field, a marker meaning 'fix this offset later', instead of hard-coding an offset.Andrii Nakryiko's BPF CO-RE post from February 2020 is the reference. BTF is also what lets fentry programs take typed arguments. It's the reason Falco made its CO-RE "modern eBPF" driver the default in 0.38: one binary, embedded in Falco, no per-kernel build.
With the program checked, rewritten and compiled, one step remains: putting it where it will run.
5.7Attaching, and one event firing
Loading isn't running. Nothing happens until something attaches the program, and each hook does that differently. That's where the cost differences in section 7 come from.
| Hook | How it's attached |
|---|---|
| XDP | The driver calls the program's compiled code directly from the code that handles each arriving packet, on the raw packet buffer, before allocating an sk_buff |
| fentry/fexit | The kernel builds a small BPF trampoline and patches the function's ftrace nop (a placeholder instruction the kernel leaves at the start of its functions for tracing) into a call to it |
| kprobe | A breakpoint instruction at the function (on arm64 without ftrace support; see below) |
| Tracepoint | A static call site the kernel compiled in, switched on by a static key, a flag the kernel patches into the code so a disabled tracepoint costs almost nothing |
Starovoitov's 2019 series introduced the trampoline with "unlike k[ret]probe there is practically zero overhead".
On arm64 the 6.10 kernel used here has no KPROBES_ON_FTRACE. With a probe attached, /sys/kernel/debug/kprobes/list showed ffff800080068830 k __arm64_sys_getppid+0x0 with no [FTRACE] flag. So each hit of a kprobe on getppid (a syscall that returns the parent process's ID and does almost no work) goes like this:
__arm64_sys_getppid, whose first instruction has been replaced.Now the XDP program on real packets. Two arrive: one for port 9999, and one for port 53 (DNS).
drops array has one slot per CPU, both still at zero.To time the program without a network card, BPF_PROG_TEST_RUN runs the same kind of code path on a packet buffer you supply. With the program pinned (saved under a path in the BPF filesystem, so bpftool can find it) and one 9999 packet and one 53 packet saved as files:
$ bpftool prog run pinned bpffs/drop data_in udp9999.bin repeat 10000000
Return value: 1, duration (average): 6ns
$ bpftool prog run pinned bpffs/drop data_in udp53.bin repeat 10000000
Return value: 2, duration (average): 6ns
Return value 1 is XDP_DROP and 2 is XDP_PASS. Five runs of each gave 5 or 6 ns every time. Afterwards the per-CPU map showed 50,000,000 drops on CPU 0 and zero in the other nine slots: five runs of ten million, all on one core, exactly as in the animation where only CPU 0's slot moved. (There are ten slots on a four-CPU machine because a per-CPU map keeps one for every CPU the kernel could ever bring online, and this kernel allowed for ten.)
The program is fast and the verifier made it safe. The next section covers the cases where the checking gets in your way, and where it fails.
06Rejections, verifier bugs and the kernel underneath
6.1The rejections everyone hits
You'll meet the verifier mostly as an error message at load time. These are the common ones:
| Error | Cause | Fix |
|---|---|---|
invalid access to packet | A missing or misshapen data_end check (section 5.3) | Compare pointer plus constant against data_end before the read. Sometimes clang reorders or merges the check into a form the verifier doesn't recognise, and you massage C until the bytecode looks right. |
back-edge from insn 9 to 2 | Any loop, before 5.3 | Unroll, or upgrade |
BPF program is too large. Processed 1000001 insn | Nearly always an explosion of paths, or a loop whose bound the verifier can't see, not a large program (section 5.4) | bpf_loop() (5.17), open-coded iterators or tail calls (one program handing control to another) |
R3 bitwise operator ^= on pointer prohibited | Pointer arithmetic the verifier won't follow, emitted by clang | Rewrite the C so the bytecode keeps pointers and scalars apart |
| Stack or helper errors | More than 512 bytes of stack across the call chain, a helper not allowed for this program type, or a GPL-only helper without a GPL license section | Move big structs into a map; check the program type's helper list |
That ^= one came from a loop test that used the packet length as the bound. Clang computed it with a bitwise trick on the pointer, and there was no ^= anywhere in the source.
It works in reverse too. Adding volatile to the loop counter, to stop clang unrolling it, made even N = 1,000 fail after 4.8 seconds. The likely cause is that a 32-bit spill to the stack loses the verifier's precise tracking of i, but that hasn't been proven.
Those errors are the verifier being too strict. Sometimes it's too lenient.
6.2When the verifier is wrong
The verifier's bounds arithmetic is the security boundary. If it believes a register is in [0, 8] and at runtime it holds 4096, a "proven" load reads kernel memory. That has happened, repeatedly:
- CVE-2020-8835. Manfred Paul at Pwn2Own 2020. Narrowing of 32-bit bounds in
__reg_bound_offset32was wrong, so a sequence of 32-bit operations produced a register whose real value was outside its tracked range. An ordinary user could become root on kernels from 5.5 until the fix. - CVE-2021-3490. Manfred Paul again, via ZDI: ALU32 bounds for AND, OR and XOR weren't updated correctly, which turned into out-of-bounds reads and writes. Fixed in commit 049c4e13714e for 5.13.
?Why could an ordinary user exploit these?
Both needed nothing but the ability to load a socket filter, the oldest kind of BPF program, which a process attaches to its own socket to choose which packets it receives. Any user without root could load one, because filtering your own socket seemed harmless. So that ability was taken away. CONFIG_BPF_UNPRIV_DEFAULT_OFF appeared in 5.13 and became default y in 5.16. It sets kernel.unprivileged_bpf_disabled to 2: off, but root can turn it back on. Ubuntu shipped that default from 21.10 and backported it to its LTS kernels in March 2022.
A bug in the verifier's reasoning lets a bad program in. There's a third kind of failure, where the checking code itself is the problem.
6.3When the kernel under the verifier is wrong
Verifier code is kernel code, and it can crash. In May 2024 Red Hat published a solution note for RHEL 9.4: loading CrowdStrike Falcon's eBPF program panicked kernels from 5.14.0-410 onward, in the verifier's backtrack_insn. Nothing was wrong with the program. The bug was in the RHEL kernel's verifier, and a later 9.4 kernel fixed it.
So "an eBPF agent can't crash the kernel" is true of what the program does while it runs. It isn't true of the kernel code that checks the program, JITs it or implements the helpers it calls. Those are ordinary kernel C, and when they're wrong they panic like any other kernel C.
That covers what can go wrong. The other question about running code in the kernel is how much time it takes away from the work the kernel was doing anyway.
07What it costs when it fires
7.1Six ways to watch one syscall
Each time a hook fires, the kernel pays to get into the program and back out, and then the program itself runs. The easiest way to see that cost is to attach a counter to a syscall that does almost no work, so that the probe is most of the difference. getppid, from section 5.7, is one. Chapter 07 found that getpid is sometimes not a syscall at all, which is why the benchmark calls syscall(SYS_getppid) directly.
Each probe below just counts, @n = count(). The figures come from an arm64 Linux 6.10 kernel in a small, shared virtual machine, where an unrelated process was making about 200,000 syscalls a second the whole time. Each row is seven runs of about five million calls pinned to one CPU, repeated in three rounds, and the table shows the median of the three round medians. The probe's count came out at about 35.7 million every time, which is the number of calls plus a handful from other processes. Absolute values change between machines, and the ordering is what carries over.
Which probe adds the least to each getppid call: kprobe, kretprobe, tracepoint, or fentry?
| Attached | ns per getppid | Added by the probe | How it's hooked |
|---|---|---|---|
| Nothing | 93 | – | Baseline, 89.7 to 93.2 across rounds |
| fentry | 106 | +13 ns | BPF trampoline via ftrace |
| tracepoint sys_enter_getppid | 115 | +22 ns | Syscall tracepoint slow path |
| fexit | 144 | +51 ns | Trampoline that calls the function itself |
| kprobe | 178 | +85 ns | BRK debug exception |
| kretprobe | 228 | +135 ns | BRK on entry plus return-address hijack |
A kprobe nearly doubled the syscall. An fentry probe on the same function added about a sixth as much.
One row is still unexplained. fexit costs four times what fentry does, +51 ns against +13 ns on the same function, in all three rounds. A small gap is expected: an fexit trampoline has to call the original function itself, save its return value and then run the program, where fentry runs the program and jumps back. But that's a few extra instructions, not 38 ns. A likely cause is something specific to arm64 in how the trampoline saves registers or handles return-address signing, but that hasn't been proven. The experiment that would settle it is perf record on the benchmark with fexit attached, to see where the extra cycles land, and then the same benchmark on an x86 machine.
Published numbers agree on the shape. Brendan Gregg's measurements for BPF Performance Tools (Linux 4.15, i7-8650U), as tabulated by Piotrowski at AsiaBSDCon 2024, put a kprobe at 78 ns per event, a kretprobe at 217 ns, a tracepoint at 99 ns and a uprobe at 1,317 ns. Piotrowski's own rerun (Linux 5.4, Xeon Gold 6226R, bpftrace 0.17) got 56, 199, 74 and 1,085 ns. A uprobe on malloc would pay that last number on every allocation, because each hit traps from user space into the kernel, so think twice before attaching one.
Those are costs for tracing, where the program watches and the event carries on. A packet filter changes the cost question.
7.2What an XDP drop costs
For packets the unit is the packet rate. A Mpps is a million packets per second, and the time per packet is one divided by that. Here's the drop program's own time next to the whole cost of an XDP drop and two alternatives:
| The drop program, one packet | BPF_PROG_TEST_RUN, 10M repeats, 5 runs | 5–6 ns |
| XDP drop, whole path, one core | 24 Mpps → 1 / 24M | 41.7 ns |
| DPDK (user-space packet toolkit) drop, one core | 43.5 Mpps → 1 / 43.5M | 23.0 ns |
| iptables raw-table drop (firewall), one core | 4.8 Mpps → 1 / 4.8M | 208 ns |
| Program share of an XDP drop | ≈ 12–14%; the driver is the rest | |
Those 24, 43.5 and 4.8 Mpps figures come from the XDP paper (Høiland-Jørgensen et al., CoNEXT 2018; Xeon E5-1650 v4 at 3.6 GHz, ConnectX-5 100 Gbit). It scaled XDP linearly until the PCI bus ran out at 115 Mpps. With conntrack loaded, the regular stack managed 1.8 Mpps. The 5–6 ns for the program comes from a different machine and skips the driver, so the share is a back-of-envelope ratio and not a measurement.
It does show where the time goes: receiving the packet (the card copying it into memory, the driver's bookkeeping, recycling the memory afterwards) is most of an XDP drop. Cloudflare's Marek Majkowski found the same ordering in 2018, on different hardware: 1.688 Mpps for an iptables raw-table drop, 1.8 Mpps for tc, and 10 Mpps for XDP.
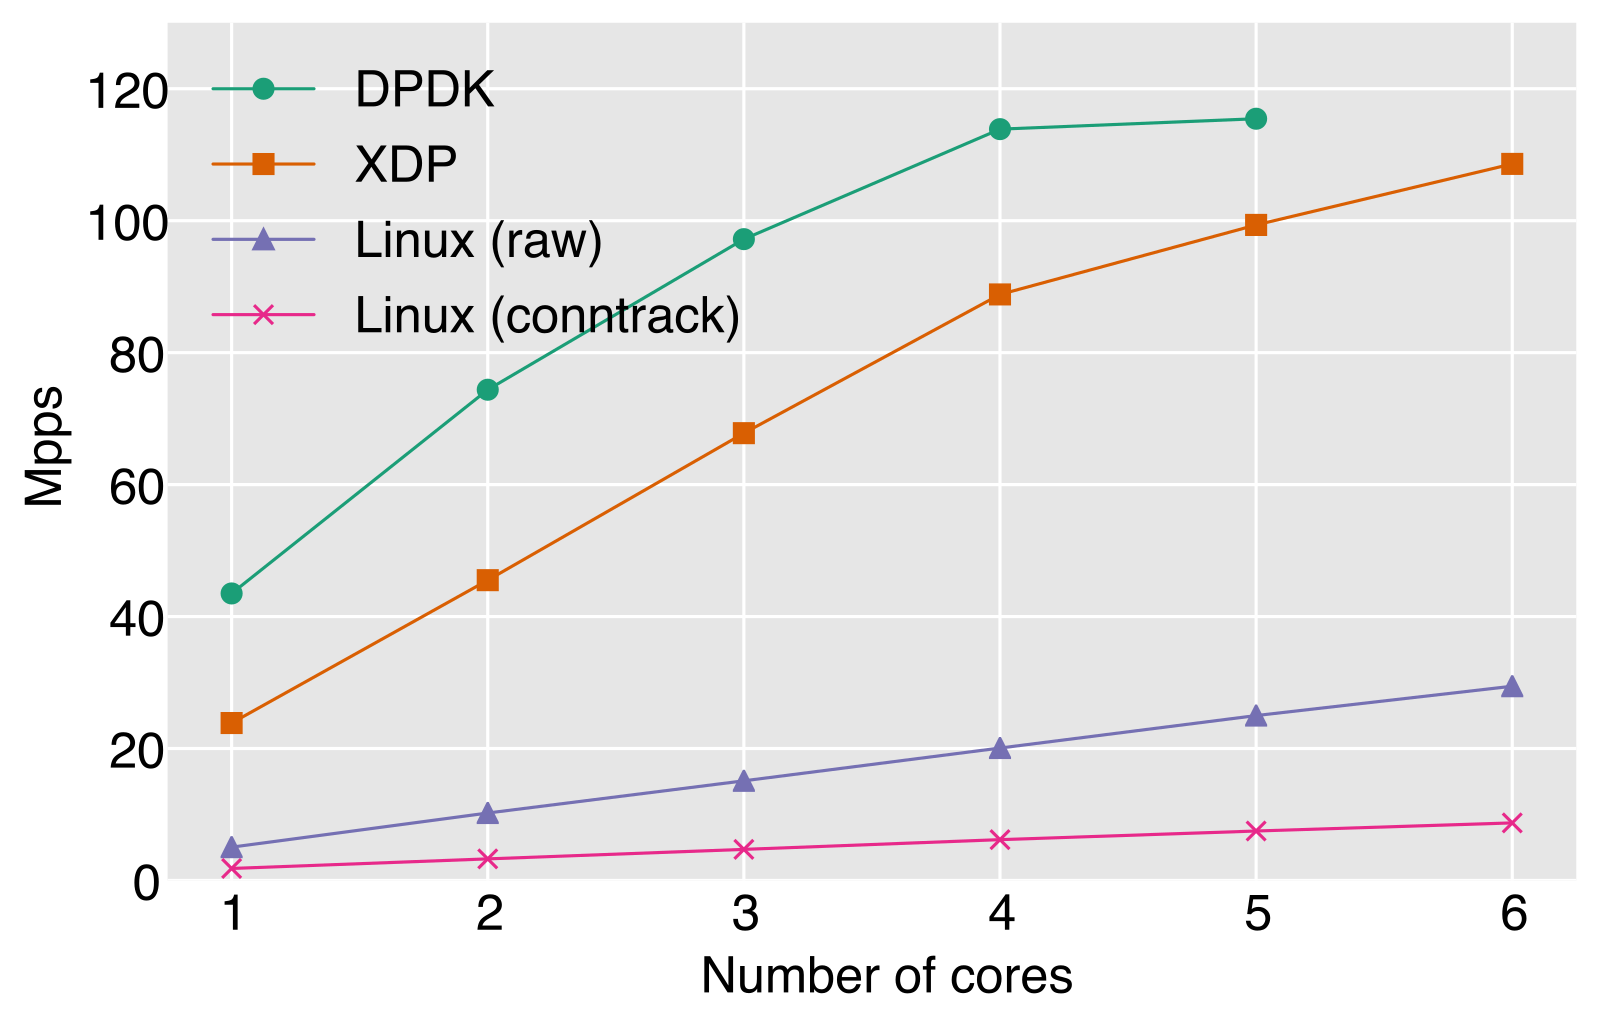
So a well-placed hook costs a few tens of nanoseconds, and an XDP program can throw away a packet several times more cheaply than the firewall can. Large companies have built products on exactly those numbers.
08Where eBPF runs in production
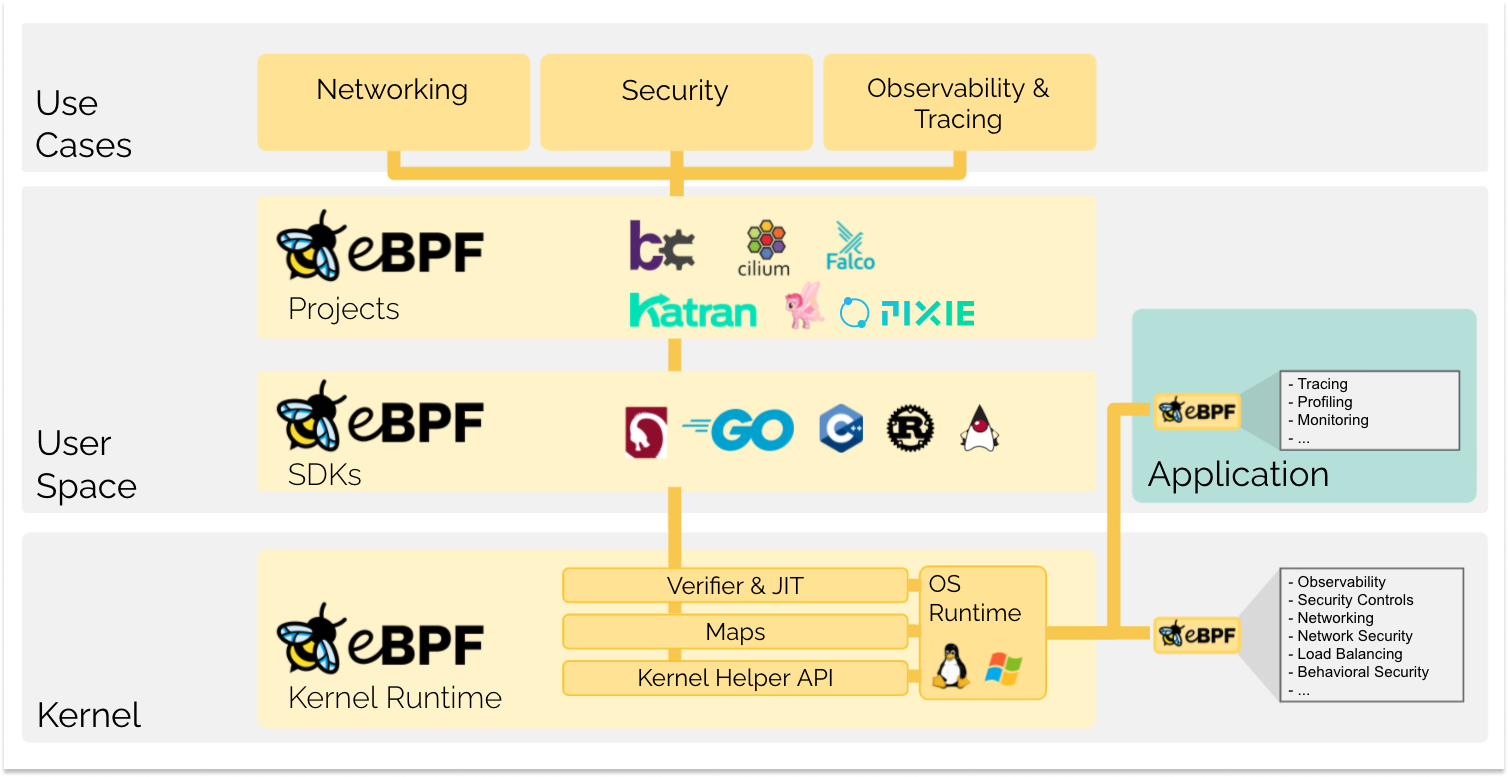
These are the best-known places where people run eBPF in production, with what each one took from it and what it was careful about.
L4Drop (November 2018) compiles DDoS (a flood of traffic meant to knock a server over) rules to C, then to XDP. During one attack it dropped over 8 million packets a second while CPU rose about 10%. Magic Transit sends customer traffic "through our XDP- and iptables-based DoS detection". When Cloudflare let customers upload their own eBPF in 2026 (Programmable Flow Protection), it checked the programs and then ran them in user space, outside the kernel.
kube-proxy turns Services into iptables rules that every new connection
walks. Cilium's kube-proxy replacement
uses BPF hash maps at tc, plus a cgroup hook on connect() that picks a
backend and rewrites the destination before a packet exists, so there's no
per-packet NAT.
Open-sourced May 2018, replacing an IPVS-based balancer. XDP picks a backend with an extended Maglev hash (a lookup table that keeps each flow on the same backend) and IP-in-IP encapsulates (wraps each packet in another IP packet addressed to the chosen backend), varying the outer source IP per flow so receive-side scaling, the card spreading flows across CPUs, spreads the load. No busy polling, so it idles near zero CPU.
Gregg's BPF Performance Tools
(2019), written while he was at Netflix, has more than 150 tools
(biolatency, execsnoop, tcplife). Many ship in Ubuntu's bpfcc-tools.
Falco 0.38 made its CO-RE ring-buffer
driver the default, with no kernel module to build.
Tetragon (open-sourced
May 2022) matches policy in-kernel and can send SIGKILL or override a
function's return value before the action completes, with no round trip
to userspace.
A Falcon content update, Channel File 291, supplied 21 input fields to a Windows kernel driver's content interpreter that expected 20. That out-of-bounds read crashed about 8.5 million Windows machines (CrowdStrike's RCA). An eBPF program that passes the verifier can't make that kind of unchecked read: every access is proven in bounds before it runs. But two months earlier, Falcon's Linux eBPF sensor had panicked RHEL 9.4 through a kernel verifier bug (section 6.3). eBPF moves the risk into a smaller, shared, heavily reviewed piece of kernel code. It doesn't make it zero.
09Watching it on a real machine
9.1Seeing what's running
Each question the chapter raised has a tool that answers it. The counter from section 1 is also the first thing to reach for on a server: the same idea, counting every syscall, tells you who is busy. Here it counts syscalls by process name for five seconds:
$ bpftrace -e 'tracepoint:raw_syscalls:sys_enter { @[comm] = count(); }
               interval:s:5 { exit(); }'
...
@[systemd-journal]: 2866
@[python3]: 3076
@[(s12-echo)]: 5252
@[systemctl]: 8654
@[systemd]: 14961
@[8]: 21006
@[negdent]: 1000027
In that output, negdent made a million syscalls in five seconds, far more than anything else. That's what this one-liner is for: someone on the box is doing something at a rate you didn't expect.
The next one answers "how long do read calls take?" It records the time at the start of each read and, at the end, adds the elapsed time to a histogram, in microseconds. It was run while dd read 64 KB blocks from /dev/zero in a loop:
$ bpftrace -e 'tracepoint:syscalls:sys_enter_read { @start[tid] = nsecs; }
    tracepoint:syscalls:sys_exit_read /@start[tid]/ {
      @usecs = hist((nsecs - @start[tid]) / 1000); delete(@start[tid]); }
    interval:s:5 { exit(); }'
@start[194852]: 384591934090
@start[151]: 386715091716
@usecs:
[0]                 2851 |@@@@                                                |
[1]                  771 |@                                                   |
[2, 4)             36457 |@@@@@@@@@@@@@@@@@@@@@@@@@@@@@@@@@@@@@@@@@@@@@@@@@@@@|
[4, 8)              6199 |@@@@@@@@                                            |
[8, 16)             2214 |@@@                                                 |
[16, 32)             250 |                                                    |
The 2–4 µs bucket is dd zeroing 64 KB per read. The stray @start lines are reads still in flight when the script exited; add END { clear(@start); } if they bother you. The long tail is cut here, and it reached the 1–2 ms bucket, which on a busy system is more likely the scheduler than read.
For programs that are already loaded, such as the ones a security agent installed, bpftool shows what's there:
# Which programs are loaded, and how big are they after rewriting and JIT? (sections 5.2, 5.5)
bpftool prog list
bpftool prog show id 194 --json            # includes the verifier's step count on newer bpftool (section 5.4)
bpftool prog dump xlated id 194            # after the verifier's rewrites (section 5.5)
bpftool prog dump jited id 194             # needs a bpftool built with LLVM or libbfd

# What did the program count? (sections 4.2 and 5.7)
bpftool map dump name drops                # per-CPU values, one per CPU

# What can this kernel do? (section 4.3)
bpftool feature probe kernel               # program types, helpers, JIT config

# What does each program cost? (section 7)
sysctl kernel.bpf_stats_enabled=1          # then run_time_ns / run_cnt per program
The last one is the one people forget. With stats on, bpftool prog show reports how many times each program ran and its total time. That's how you find out a security agent's kprobe is eating a few percent of your cores. It adds a clock read or two per invocation, so it's off by default. How large that overhead is hasn't been measured.
9.2Rules that hold up
- Prefer fentry over kprobe, and tracepoints over both, where the kernel has them. The numbers in section 7 say 13 ns against 85 ns on the same function.
- Check
unprivileged_bpf_disabledon every host image you own. It should read 1 or 2 unless you have a specific reason (section 6.2). - Ask your vendors which hooks they use. A kretprobe on a hot path costs 100+ ns per call, and
bpf_stats_enabledwill show it. - Read verifier logs from the bottom up. Find the register it complains about and where its
r=or bounds should have been raised. It's usually a missing comparison (section 5.3). - Disassemble the
.obefore trusting that the verifier saw your loop (section 6.1).
9.3What you trade for what
| You get | You pay | When the bill arrives |
|---|---|---|
| Kernel code without a kernel module | Only what the verifier can prove, in a restricted C | When a correct program is rejected and you rewrite it to please a static analyser |
| No crash from the program itself | A 21,800-line verifier in your trusted base | As CVEs, and as a disabled unprivileged API |
| Hooks almost anywhere | kprobes on unstable internals | When a kernel upgrade silently detaches your tool |
| Cheap in-kernel filtering | 85 ns per kprobe hit, 1+ µs per uprobe | On the hottest function you chose to trace |
| Drops at 24 Mpps per core | No skb, no stack features, driver support needed | When you want conntrack (connection tracking) or GRO (merging small packets) before your program |
| One binary across kernels with CO-RE | Needs BTF in the kernel | On old or stripped distribution kernels |
9.4Symptom, cause, fix
| Symptom | Likely cause | Fix |
|---|---|---|
| A tool silently attaches to nothing after a kernel upgrade | A kprobe on a function that was inlined or renamed | Use a tracepoint, or fentry with BTF and CO-RE |
| A security or observability agent costs a few percent of CPU | A kprobe or kretprobe on a hot path | bpf_stats_enabled=1, then ask the vendor which hooks it uses |
A tiny program is too large | Path explosion, or a loop simulated iteration by iteration | bpf_loop(), iterators, tail calls |
invalid access to packet on a line that looks fine | The data_end comparison is missing or not in a form the verifier recognises | Add pointer plus constant against data_end before the read |
| Non-root users can load BPF | unprivileged_bpf_disabled is 0 | Set it to 1 or 2 in the host image |
10Summary
- eBPF runs your code in the kernel only after proving it safe. The verifier checks memory access, termination and allowed calls once, at load, which is why the counter in section 1 could be loaded into a running kernel.
- Safe means the kernel survives. Your service is another matter: a program that drops every packet passes the verifier.
- A program is eight-byte instructions over eleven registers, with a map for anything it must remember. Per-CPU maps let a counter avoid atomics.
- The verifier is an abstract interpreter. It walks every path, tracking a type, bounds and a packet range for each register.
- It learns bounds only from your comparisons.
invalid access to packetmeans adata_endcheck is missing before the read. - The million-step limit counts steps of the walk. A 13-instruction loop cost 8 × N + 5 steps, so it stops loading at N = 125,000 whatever the program's length.
- Programs that pass the verifier are rewritten and JIT-compiled. An interpreter sketch was about 10× slower, and kernels built with JIT always on ship no interpreter at all.
- CO-RE lets one binary run on many kernels. Clang records field relocations and libbpf patches them from the kernel's BTF.
- Hooks differ by an order of magnitude. fentry added 13 ns to a syscall, a kprobe 85 ns and a kretprobe 135 ns.
- The verifier is itself attack surface. Two bounds-tracking CVEs are why unprivileged BPF is off by default from 5.16, and a verifier bug has panicked a production kernel.
- Most of an XDP drop is the driver's work. The program took 5–6 ns of an XDP drop that costs about 42 ns per packet in the XDP paper.
11Build this
Write an XDP drop filter, then fight the verifier on purpose.
- Write the port-9999 filter from section 5 with a
PERCPU_ARRAYcounter. Compile withclang -O2 -g -target bpfand load it withbpftool prog load. - Delete the first
data_endcheck and read the log. Then put it back with>=instead of>and see whether the verifier still accepts it (think about it first). - Time it with
bpftool prog run ... repeat 10000000, then attach it to a veth pair (a virtual network cable between two interfaces) and send UDP withiperf3 -u. Do the counter andiperf3agree? - Loop over the payload bytes, find where the verifier gives up, then rewrite with
bpf_loop()and watch the step count drop.
12Interview questions
beginnerWhat does the eBPF verifier guarantee, and what doesn't it?›
It guarantees in-bounds memory access for each pointer's type, termination within the complexity limit, and only the helpers the program type allows. It doesn't promise correctness, cost or harmlessness to your service: an XDP program that drops everything is perfectly safe. It also doesn't protect you from bugs in the verifier itself or in the kernel code a program calls.
beginnerWhy do XDP programs have to compare against data_end before reading a header?›
The verifier tracks how many bytes past each packet pointer are proven to exist, and only a comparison against data_end raises that number. Without it you get invalid access to packet. The check is also needed at runtime: a truncated packet can be shorter than a header.
intermediateA 15-instruction program fails with 'BPF program is too large. Processed 1000001 insn'. How?›
The limit counts steps of the walk, not program size. Loops are simulated once per iteration, and branches multiply paths unless pruning finds an equivalent state. A 13-instruction program whose loop body is eight instructions costs exactly 8N + 5 steps, so it fails at N = 125,000. Fixes: bpf_loop(), iterators, or tail calls.
intermediatekprobe or fentry for a hot kernel function, and why?›
fentry, if the kernel has BTF and trampolines. A kprobe hits a breakpoint exception (on arm64 a BRK) and the handler has to find and run the probe, while fentry is a direct call into a generated trampoline from the function's ftrace nop. On a getppid benchmark a kprobe added about 85 ns and fentry about 13 ns.
intermediateWhy use a per-CPU array for a packet counter?›
A shared counter needs an atomic add, and the cache line bounces between every core that increments it. Per-CPU slots make it a plain load, add and store, and user space sums the slots when it reads.
deepWhat problem does CO-RE solve, and how does it work?›
Struct layouts differ across kernels, so a program built against one kernel's headers reads garbage on another. With CO-RE, clang records field accesses as relocations, the kernel publishes its types as BTF, and libbpf patches offsets at load time. One binary, many kernels, no compiler on the host.
deepWhy is unprivileged eBPF disabled by default on modern kernels?›
Because the verifier is the security boundary and it has had exploitable bugs. CVE-2020-8835 and CVE-2021-3490 were both bounds-tracking errors in 32-bit arithmetic that let an unprivileged socket filter read and write kernel memory. There's also a Spectre angle: attacker-controlled code running in the kernel makes speculation gadgets easy. CONFIG_BPF_UNPRIV_DEFAULT_OFF became default y in 5.16.
deepCould an eBPF-based agent have caused the CrowdStrike outage?›
Not by that mechanism. Windows crashed because of an unchecked out-of-bounds read in a kernel driver's content interpreter, and the verifier rejects any eBPF program that could make an unproven read. But eBPF agents run on top of kernel code that can still be buggy: in May 2024 Falcon's eBPF sensor panicked RHEL 9.4 in the verifier itself. And a program that passes the verifier can still drop all traffic or kill processes by policy. Smaller risk, not zero.
13Go deeper
Your loop with a bound of 4 billion loads without complaint. What happened?›
Probably the compiler removed the loop, for example by computing a closed form. Disassemble the .o with llvm-objdump before trusting that the verifier saw it.
What does R1_w=pkt(r=0) mean in a verifier log?›
r1 is a pointer into packet data, and zero bytes past it are known to be before data_end. Any load through it will be rejected.
Which setting stops non-root users loading BPF programs?›
kernel.unprivileged_bpf_disabled, 1 or 2. It's 2 by default from 5.16.
The source.
Start at do_check and is_state_visited; the block comments at the top
of the file are the best design doc there is.
How loops were allowed, and why pruning points moved. Pair with Taking BPF programs beyond one-million instructions from 2025.
The XDP paper. Where 24 Mpps and about 42 ns per packet come from, and an honest comparison with DPDK.
How relocations and BTF fit together, from the libbpf maintainer.
The instruction set as a standard: opcodes, registers and the conformance groups.
The book, and the overhead methodology section 7 compares against.
14Related chapters
The ~350 ns crossing, and why the
benchmark here calls syscall(SYS_getppid) directly instead of trusting libc.
The path a packet takes after XDP says
XDP_PASS: skb allocation, tc, netfilter, sockets.
cgroups: where systemd's sd_fw_* programs and
Cilium's connect() hook attach.
Cache-line bouncing, the whole argument for a per-CPU counter.