Your server is listening on port 9000, a number the machine uses to tell which program should get incoming traffic. Somewhere on the network a client sends it a short request, GET /, about a hundred bytes. Your code calls read() on its socket, the handle the kernel gives a program for talking over the network, and gets exactly those hundred bytes back, in order, as if the client had written them straight into your memory.
Nothing between the two machines works like that. The network carries small, separately addressed pieces called packets, and any of them can arrive late, twice, out of order or never. A busy machine receives thousands of them every millisecond and can't give any one its full attention. So on the way from the wire to your read(), our request is copied, wrapped in bookkeeping, checked by a firewall, matched to a socket and left to wait in line. Think of a mailroom whose trays have a fixed number of slots: when a tray is full, new letters go in the bin.
The kernel, the part of the operating system that owns the hardware, does all of this, and the code that does it is called the network stack. This chapter asks one question: when a client sends your server a request, where does it go inside the machine, and where can it be lost without anyone being told? We'll follow one request in and one reply out, count the waiting lines on the way, and learn which counter to read for each one.
01What read() hands you
1.1Three sends, two protocols
Before we look inside, let's see what a program gets. Pretend the client sent its request in three small pieces, one, two and three, and did it twice, once with each of the two most common protocols. A protocol is an agreed set of rules for how two programs talk: what the messages look like and what each side promises. The two are TCP and UDP.
The script below runs a server and a client inside one process. The address 127.0.0.1 is the one every machine uses for itself, so the data never reaches a network card, but it still goes through the kernel's network stack (section 6 comes back to this). Port 0 asks the kernel to pick any free port. For TCP, the server calls listen() and accept() to take a connection the client opened with connect(), and the client calls send() three times. UDP has no connection: sendto() addresses each message separately, and recvfrom() reads one message at a time. The sleep gives the kernel a moment to deliver everything before we read.
import socket, time

# TCP: three separate sends
srv = socket.socket(); srv.bind(("127.0.0.1", 0)); srv.listen()
cli = socket.socket(); cli.connect(srv.getsockname())
conn, _ = srv.accept()
for word in (b"one", b"two", b"three"):
    cli.send(word)
time.sleep(0.1)
print("TCP  received:", conn.recv(100))

# UDP: three separate sends
rx = socket.socket(socket.AF_INET, socket.SOCK_DGRAM); rx.bind(("127.0.0.1", 0))
tx = socket.socket(socket.AF_INET, socket.SOCK_DGRAM)
for word in (b"one", b"two", b"three"):
    tx.sendto(word, rx.getsockname())
time.sleep(0.1)
print("UDP received:", [rx.recvfrom(100)[0] for _ in range(3)])TCP received: b'onetwothree'
UDP received: [b'one', b'two', b'three']TCP handed over a single read containing onetwothree, with the three sends run together. UDP kept three messages apart. Both protocols got the same three sends and gave different answers, and what each one promises explains why.
1.2What each protocol promises
TCP promises a stream of bytes: everything you send arrives, in order, with nothing missing. It keeps no record of where your sends began and ended, so three sends can arrive as one chunk, or one send as three. That's why protocols built on TCP, HTTP for one, put lengths or delimiters inside the data. UDP promises datagrams: each send is one message, and it's delivered whole or not at all.
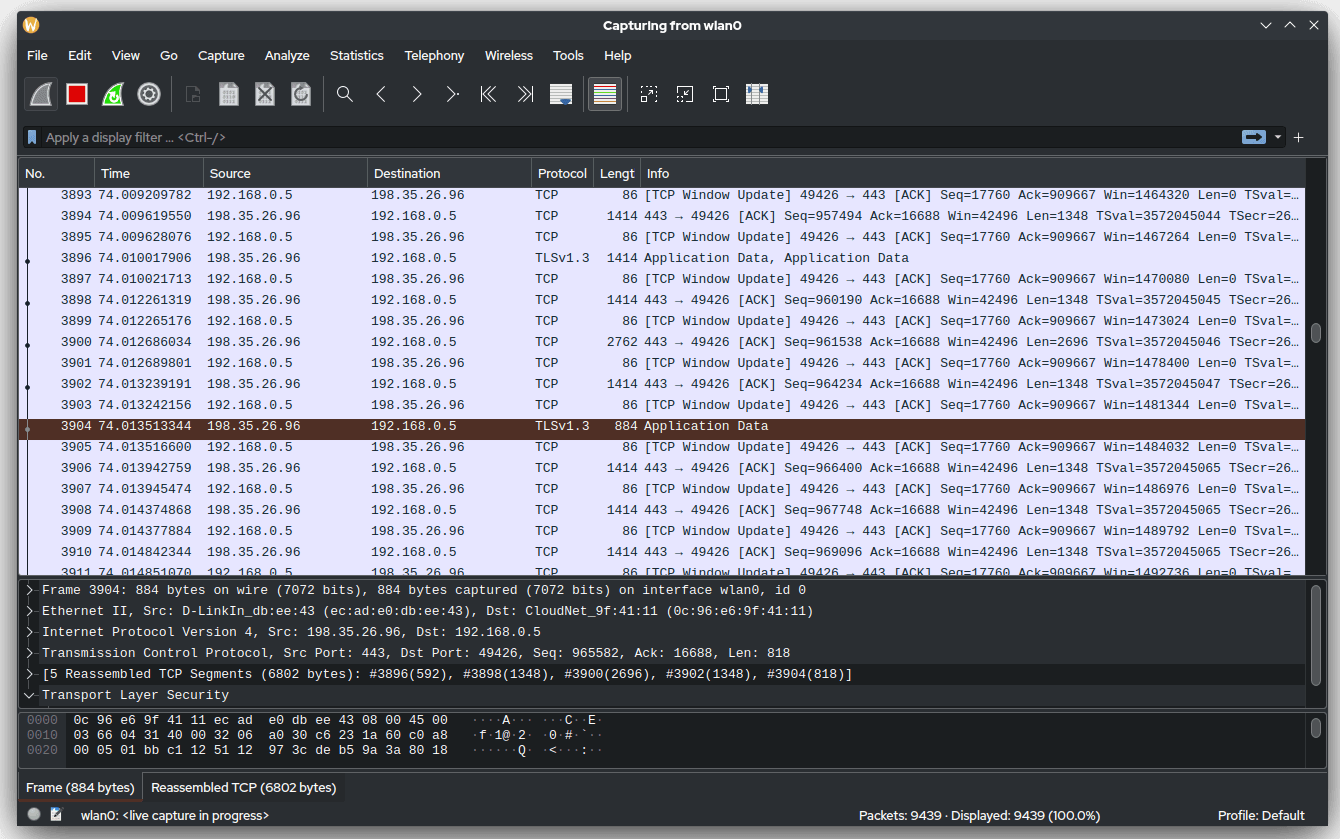
Underneath both sits the same network, which delivers packets with no promises whatever. Between the wire and your recv(), the kernel turned those packets into a clean stream or a clean message. This work is the network stack, and the rest of the chapter follows it one packet at a time, marking each place a packet can be lost.
| Protocol | What you're promised | What you're not |
|---|---|---|
| TCP | An ordered, reliable byte stream per socket | How long it takes, or how many times packets are re-sent |
| UDP | Each datagram arrives intact, or not at all | That it arrives, arrives once, or arrives in order |
?Why doesn't TCP's reliability mean nothing gets dropped?
Because the reliability is about the stream, and the packets underneath can still go missing. TCP hides loss by re-sending: the receiver sends back a short acknowledgement (ACK) for the bytes it has, and the sender re-sends anything that stays unacknowledged. A dropped packet therefore costs you time, and the data still arrives. UDP does no re-sending, so a drop shows up as a message that never arrives.
Neither promise limits how many packets the kernel may throw away along the way, and it throws away a lot, every time a waiting line fills up.
To find those lines we'll follow one packet in, starting with the first problem it meets: getting off the wire and into memory without drowning the CPU.
02From the wire into memory
2.1The naive way: one interrupt per frame
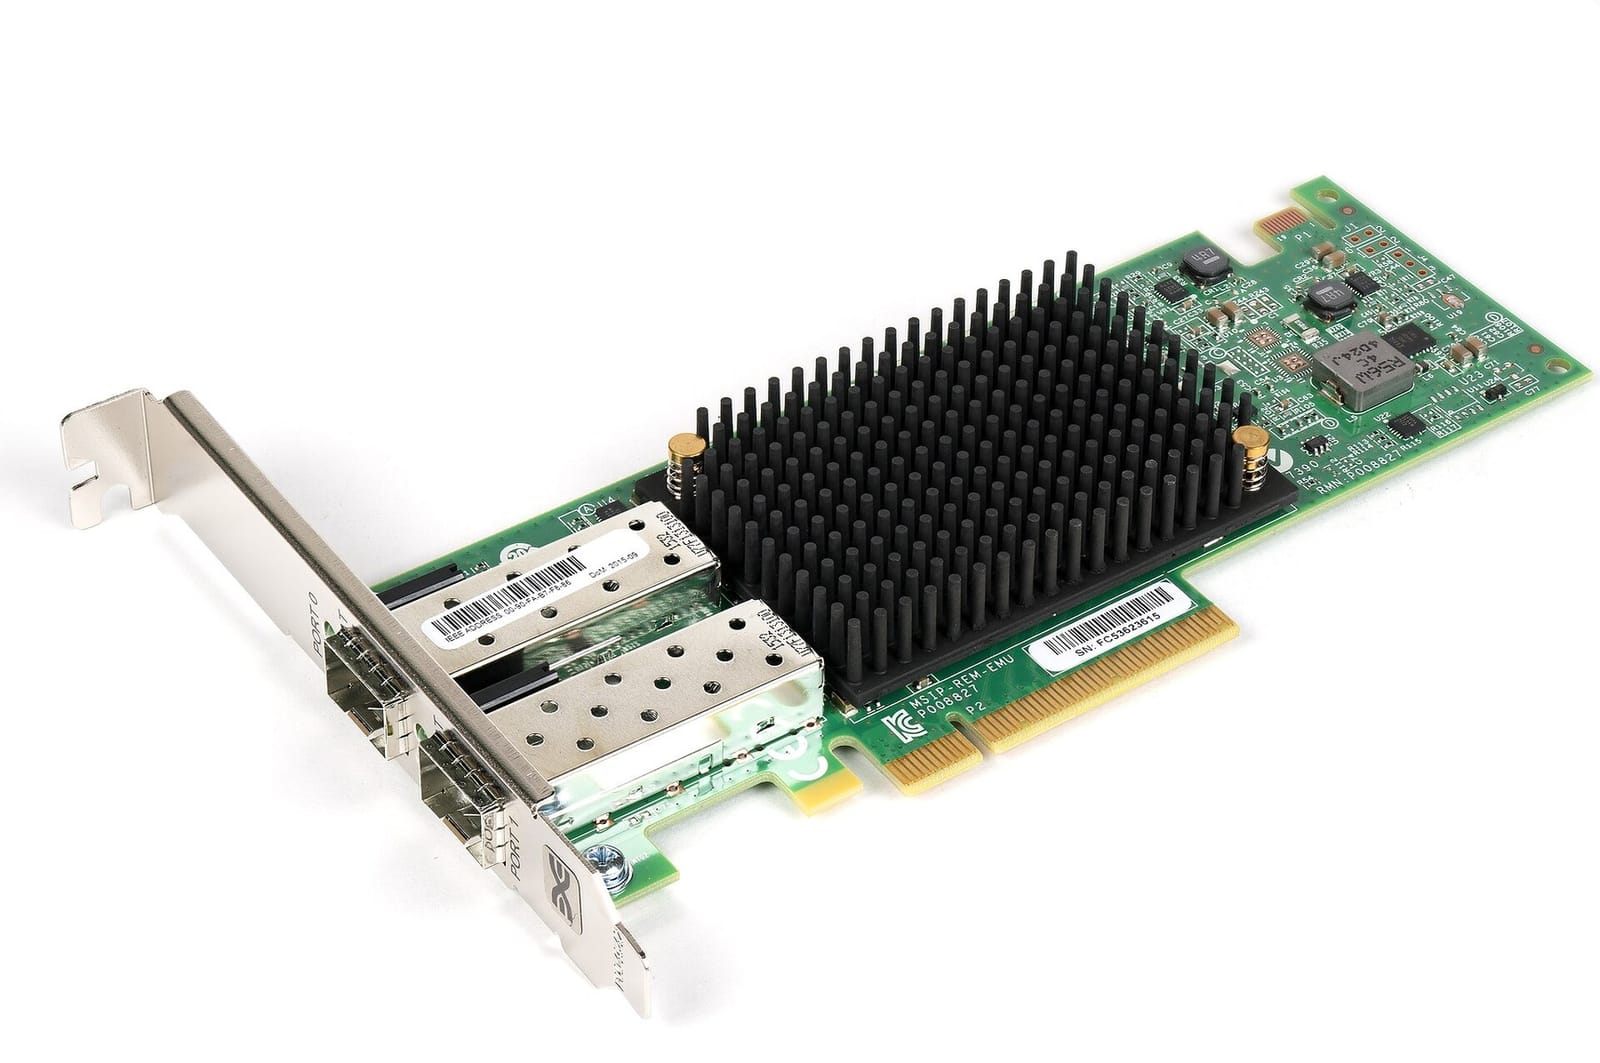
The network interface card, or NIC, is the hardware at the end of the cable. It receives each packet wrapped in an Ethernet frame, which adds a few bytes of addressing in front of the packet. A block of labelling bytes in front of some data like this is called a header. Behind the packet the frame carries a checksum, a short number computed from the frame's bytes so the card can tell whether it was damaged on the way. Inside the frame there are two more headers before our hundred bytes. The IP header (IP is the Internet Protocol) says which machine the packet is going to, and the TCP header says which connection it belongs to and where it fits in the stream. Our whole request fits in one small frame.
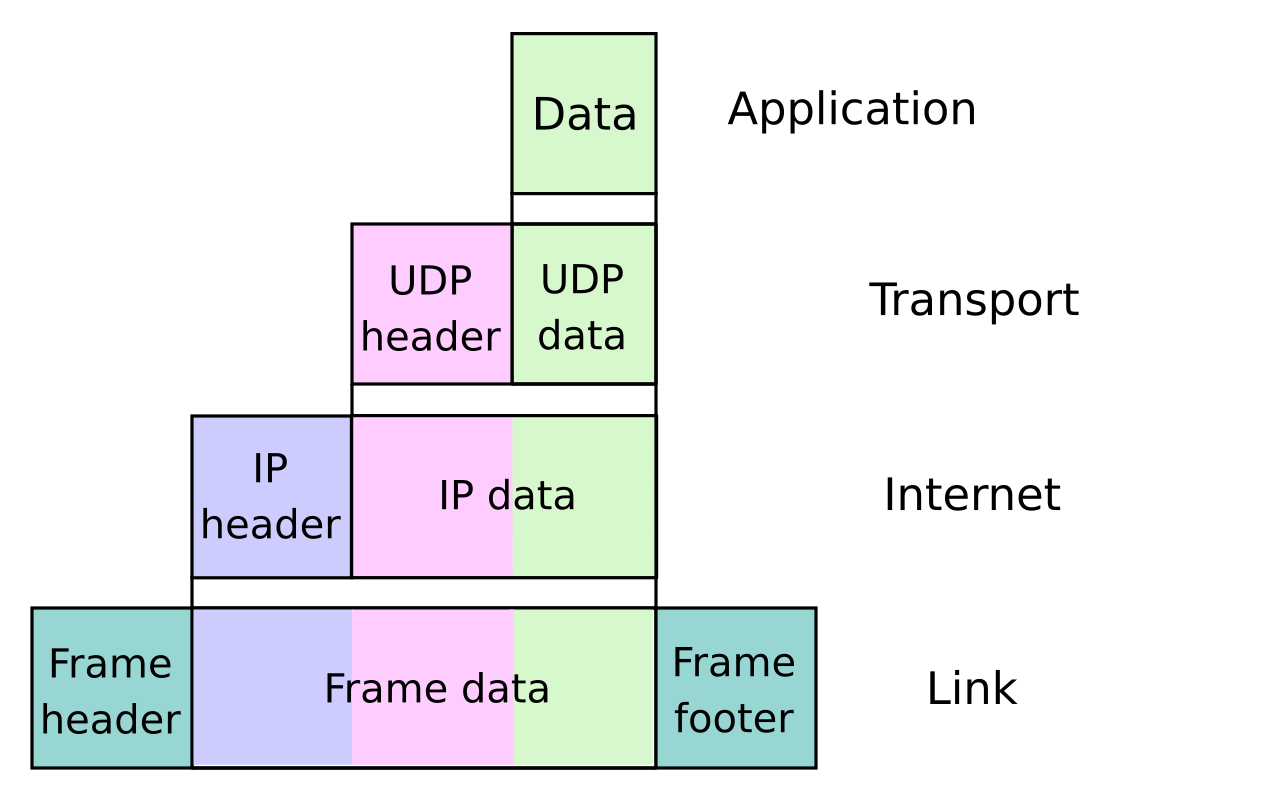
The simplest way for the card to hand a frame to the kernel is an interrupt: a signal that makes a CPU drop what it's doing, run a small piece of kernel code called the handler, and then carry on. The handler copies the frame's bytes from the card into memory, and the card interrupts again for the next frame. That works at dial-up speeds, and it stops working long before today's.
Do the arithmetic. The smallest frame is 64 bytes, and a 10 Gbit/s link can carry close to 15 million of them a second (section 9 works it out), one every 67 nanoseconds. A core that took an interrupt for every one of them would do nothing else. Modern drivers make two changes to avoid this.
2.2Letting the card write to memory by itself
The first change is to stop asking the CPU to move the bytes. The driver, the kernel code written for one particular card, sets aside a ring: a fixed number of slots used round and round, so that after the last slot the card starts again at the first. Each slot holds a descriptor, a small record that points to an empty buffer in memory which the driver allocated in advance. The card then uses DMA (direct memory access) to write each arriving frame into the next free buffer, all by itself. No CPU has touched a byte.
Our frames are now in memory, but the kernel doesn't know they're there. If the card interrupts for each one, we're back to fifteen million interrupts a second.
2.3Polling instead of interrupting
The second change moves the asking from the card to the kernel. The card raises one interrupt when frames start arriving. The handler switches off further interrupts from the card's ring, which is called masking them, and schedules a softirq: a piece of deferred interrupt work that runs soon afterwards on the same CPU, ahead of any ordinary thread. The softirq polls the ring, meaning it looks at the ring over and over and takes frames in batches. Only when the ring is empty does it switch interrupts back on.
Linux calls this scheme NAPI, the "new API", and LWN's history is still the best account of it. When the machine is busy, it pays for one interrupt and then polls through a long run of frames. When it's quiet, the next frame raises a fresh interrupt, so an idle machine still answers at once. Here is our request arriving together with two other packets:
GET /. The card checks that each is addressed to it and that the checksum is good.2.4The softirq budget
Polling until the ring is empty has a danger of its own. If frames arrive as fast as the softirq can take them, the ring never empties. Softirqs run ahead of every ordinary thread on their CPU, so a flood could keep one CPU in softirq forever, and nothing else on it, your application included, would get to run. The polling loop therefore has a budget, a limit on how much it may do in one run. Here it is:
static __latent_entropy void net_rx_action(struct softirq_action *h)
{
	struct softnet_data *sd = this_cpu_ptr(&softnet_data);
	unsigned long time_limit = jiffies +
		usecs_to_jiffies(READ_ONCE(net_hotdata.netdev_budget_usecs));
	int budget = READ_ONCE(net_hotdata.netdev_budget);
	/* ... */
	for (;;) {
		struct napi_struct *n;
		/* ... empty-list handling ... */
		n = list_first_entry(&list, struct napi_struct, poll_list);
		budget -= napi_poll(n, &repoll);

		/* If softirq window is exhausted then punt.
		 * Allow this to run for 2 jiffies since which will allow
		 * an average latency of 1.5/HZ.
		 */
		if (unlikely(budget <= 0 ||
			     time_after_eq(jiffies, time_limit))) {
			sd->time_squeeze++;
			break;
		}
	}
	/* ... re-queue anything unfinished, re-raise the softirq ... */
Read it from the top. budget starts as a count of packets, and every call to napi_poll subtracts the number of packets it handled. time_limit is a deadline, measured in jiffies, which are ticks of the kernel's timer, 1 ms each when the kernel ticks a thousand times a second. The loop stops at whichever limit it hits first, and the settings that control the limits are:
| Setting | Default | Meaning |
|---|---|---|
netdev_budget | 300 | Packets per softirq run, across all devices |
netdev_budget_usecs | 2 jiffies (2,000 µs at 1,000 ticks a second) | Time per softirq run |
dev_weight | 64 | Packets one device's poll() may take per turn |
When the loop runs out of budget with work still waiting, it adds one to time_squeeze and leaves the rest for later. That counter is the third column of /proc/net/softnet_stat, a file with one line of counters per CPU, and it's the only direct evidence that a CPU couldn't keep up with its queues.
The request is now out of the ring and in the kernel's hands. The next question is what the kernel carries it in.
03A record for each packet, and the climb up the stack
3.1sk_buff: a record about a packet
A packet has to pass through several layers of code, and each layer wants to look at its own header, strip it off, and hand the rest upwards. Copying the bytes at every step would be slow, so the kernel keeps a small record about each packet and passes the record around instead. A record that describes a thing and doesn't contain it is called metadata. In Linux every packet is described by a struct sk_buff, short for "socket buffer", usually called an skb. It doesn't contain the packet's bytes. It points at them.
struct sk_buff {
	union {
		struct {
			/* These two members must be first to match sk_buff_head. */
			struct sk_buff		*next;
			struct sk_buff		*prev;
			/* ... dev ... */
		};
		/* ... */
	};
	struct sock		*sk;
	char			cb[48] __aligned(8);
#if defined(CONFIG_NF_CONNTRACK) || defined(CONFIG_NF_CONNTRACK_MODULE)
	unsigned long		 _nfct;
#endif
	unsigned int		len,
				data_len;
	__u16			transport_header;
	__u16			network_header;
	__u16			mac_header;
	/* These elements must be at the end, see alloc_skb() for details.  */
	sk_buff_data_t		tail;
	sk_buff_data_t		end;
	unsigned char		*head,
				*data;
	unsigned int		truesize;
	refcount_t		users;
	/* ... */
};
A handful of fields do most of the work:
| Field | What it's for |
|---|---|
next, prev | Lets the skb sit on a queue with no extra allocation. Every queue in this chapter is a list of these. |
head, data, tail, end | Bracket the real buffer. data moves forward as each layer strips its header, so IP never copies the Ethernet frame. |
mac_header, network_header, transport_header | 16-bit offsets from head to each layer's header |
_nfct | Conntrack's pointer to this packet's flow entry (section 3.3 introduces conntrack) |
len | How many bytes of packet data the skb describes |
truesize | How much memory the socket is charged for this skb, which is always more than len |
truesize matters because a socket's receive buffer, the memory limit on how much unread data it may hold, is charged by truesize and not by the bytes you'll recv(). The skb struct and the whole memory allocation behind the data count against the limit, so a small message costs far more buffer than its length suggests. Section 5.1 shows by how much.
Past end, in the same allocation, sits an skb_shared_info with an array of frags[], each one a reference to a page, the 4 KB unit in which the kernel hands out memory. That array is how the stack avoids copying. The next subsection uses it to glue packets together, and section 8 uses it to send file data without copying.
3.2Merging packets: GRO
A stack spends roughly the same effort on a packet whatever its size, so the cheapest way to save work is to have fewer, bigger packets. All the packets of one connection together make up a flow. The kernel recognises which flow a packet belongs to by four numbers in its headers, the source address and port and the destination address and port, together called the 4-tuple. Inside the driver's poll, each frame goes to napi_gro_receive(), where GRO (generic receive offload; LWN covered it in 2009) holds packets from the same flow and merges consecutive ones into one large skb by appending their pages to frags[]. About forty-five 1,500-byte segments can travel up the stack as one 64 KB skb, and pay the per-packet cost once.
3.3The climb
After GRO the packet makes its way through a chain of function calls, all inside the same softirq. Three stops are optional and you may never configure them. An XDP (eXpress Data Path) program, if one is attached, sees the raw buffer first, before any skb exists, and can drop it on the spot (section 8 returns to this). RPS, if switched on, may hand the packet to another CPU (section 6). tc ingress, from "traffic control", has hooks for policing the packet rate and for filters written as BPF programs, small programs the kernel runs safely at hook points like these (chapter 48 covers them).
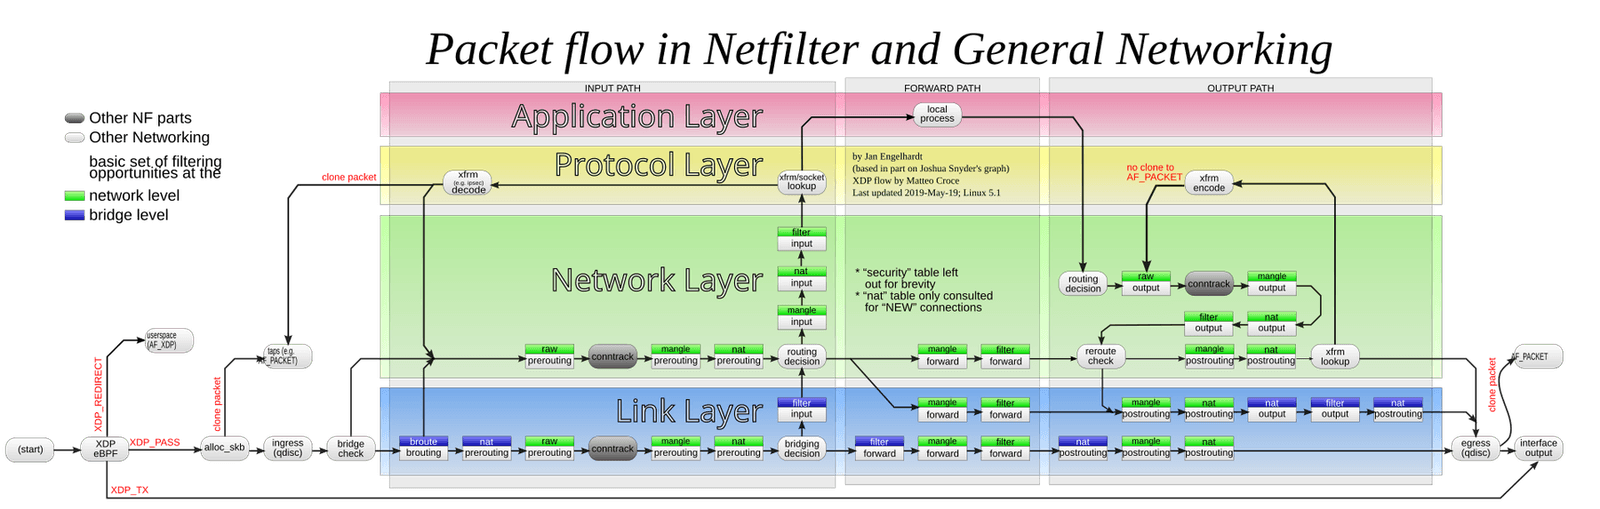
Next comes IP, which checks that the packet is addressed to our server, and then netfilter, the kernel's firewall framework. If you've written iptables rules, they run at netfilter's hooks, the points along the path where it gets a look at every packet. At the first of them, PREROUTING, conntrack (connection tracking), when it's loaded, looks the packet's flow up in a hash table and creates an entry if the flow is new. A firewall that lets in replies to connections your machine opened depends on this memory of flows. So does NAT (network address translation), which rewrites packets' addresses and has to remember each rewrite so it can undo it on the replies. Section 5.3 shows what happens when that table fills. Once routing has decided the packet is for our server, a later hook, INPUT (LOCAL_IN inside the kernel), runs any iptables rules you wrote for incoming traffic.
Last comes TCP. tcp_v4_rcv() finds the socket that owns this 4-tuple. If a user thread holds the socket lock, the flag that keeps two pieces of code from changing the socket at once, the skb waits on the socket's own backlog list until the lock is released. (Linux uses the word backlog for three different queues, and we'll meet the other two in section 5.) Otherwise a fast path appends the data to the socket's receive queue. Here is the whole chain, in order:
Two facts about this climb matter for everything after it. The CPU first touches our packet when the softirq polls the ring, and every hand-off from there on is a queue of fixed size. The last queue is the socket's own, and it's where your thread comes in.
04Waking your thread
4.1The socket's receive queue
Every socket has a receive queue: a list of skbs holding bytes that have arrived and that your code hasn't read yet. TCP puts the request's bytes in order, appends them to the queue and sends back an ACK. Your thread is somewhere else entirely, asleep until there's something to read.
A server with thousands of connections can't afford a sleeping thread for each, so it uses epoll, the system call that lets one thread give the kernel a whole set of sockets and sleep until any of them is ready. When TCP appends data, it calls sk_data_ready(), and that wakes whoever is waiting on the socket. If you're blocked in read(), that's you. If the socket is in an epoll set, epoll's callback puts the socket on its ready list and wakes the thread in epoll_wait(). The scene below names our socket by its file descriptor, the small number (here 7) that your program uses to refer to it.
epoll_wait(). The socket's receive queue is empty.4.2One connection, many wake-ups
?Why can one connection wake every worker?
A server has one listening socket, the one it called listen() on, and new connections arrive there before each gets a socket of its own. Suppose several worker threads each wait in their own epoll set on that same listening socket. A single new connection wakes all of them, though only one can take it, and the rest wake up for nothing. This is the thundering herd. The EPOLLEXCLUSIVE flag (Linux 4.5, man page) limits the wake-up to one waiter.
But which one? Cloudflare found that wake-ups go LIFO, last in, first out: the waiter that most recently started waiting gets the connection. A worker that finishes quickly goes straight back to the front of the line, so one worker of the NGINX web server ended up with most of the load.
The receive queue is one waiting line of fixed size. The path we just followed has several more, and now we need to know what each one does when it fills.
05When a queue is full
Every hand-off on the receive path is a waiting line of fixed size, and a line that's full drops whatever arrives next. Your program isn't told and neither is the sender. The packet is gone, and a counter somewhere goes up. Each queue keeps its count in a different place, so the work is knowing which counter belongs to which line.
We'll walk back from your application towards the wire, which is the order in which you check them on a bad day. The first line is the one we just left.
5.1The socket receive buffer
A socket's receive queue holds bytes until your code reads them, so a program that reads slower than data arrives will fill it. What happens then depends on the protocol. TCP's receiver tells the sender how much room it has left, its receive window, and the sender slows down before the queue overflows, so a full queue costs time and not data. UDP has no such flow control, the receiver's way of telling the sender to slow down. A UDP sender keeps sending, and what doesn't fit is lost with nobody told.
Here is a UDP socket that asks for a 64 KB receive buffer and never reads. A sender then fires 10,000 datagrams of 100 bytes each at it.
A UDP socket asks for a 64 KB receive buffer and never reads. 10,000 datagrams of 100 bytes arrive. How many are waiting in the socket afterwards?
The listing below shows the heart of the program, leaving out the includes and the bookkeeping that declares its counters. It calls setsockopt with SO_RCVBUF to ask for a receive buffer size, and reads back the size the kernel set with getsockopt. It sends the 10,000 datagrams, then drains the socket with recv and MSG_DONTWAIT (return at once instead of waiting) and counts what was there. Afterwards, nstat, a tool that prints the kernel's network counters as changes since its last call, shows what the kernel recorded.
int rx = socket(AF_INET, SOCK_DGRAM, 0);
int want = 65536, got = 0;
socklen_t l = sizeof got;
setsockopt(rx, SOL_SOCKET, SO_RCVBUF, &want, sizeof want);
getsockopt(rx, SOL_SOCKET, SO_RCVBUF, &got, &l);
bind(rx, (sockaddr*)&a, sizeof a);             // 127.0.0.1:9001

int tx = socket(AF_INET, SOCK_DGRAM, 0);
char payload[100] = {};
for (int i = 0; i < 10000; i++)
    if (sendto(tx, payload, sizeof payload, 0, (sockaddr*)&a, sizeof a) == sizeof payload) ok++;

while (recv(rx, buf, sizeof buf, MSG_DONTWAIT) > 0) queued++;asked for SO_RCVBUF=65536, kernel says 131072
sendto() succeeded 10000 times out of 10000
datagrams actually waiting in the socket: 158
UdpInDatagrams 158
UdpInErrors 9842
UdpRcvbufErrors 9842Three things stand out. First, the kernel doubled the request: asked for 65,536 bytes, it reports 131,072, because __sock_set_rcvbuf() stores val * 2 to leave room for skb overhead. Second, even with that doubling, only 158 datagrams were waiting. Dividing 131,072 bytes by 158 gives about 830 bytes of buffer per 100-byte payload, the truesize charge: the skb struct plus the whole block of memory behind the data. Sizing a UDP buffer as "buffer divided by message size" is off by roughly 8 times for small messages. Third, the sender got success for all 10,000 sends, and the receiver got 158. The missing 9,842 were counted in UdpRcvbufErrors and nowhere else.
For DNS servers, statsd collectors and syslog receivers, UdpRcvbufErrors is the first counter to check. Raising SO_RCVBUF also needs net.core.rmem_max, the system-wide cap on what a program may ask for, raised as well (its default is 212,992), or the request is silently capped.
?So should TCP buffers just be huge?
No. TCP can't lose data this way, but a huge buffer costs time. The kernel lets a TCP socket's receive buffer grow up to the maximum in the tcp_rmem setting, and when the queue reaches its limit, the softirq stops to compact it with tcp_collapse(), copying the data into fewer, fuller skbs. The bigger the queue, the longer that takes. Cloudflare's story of one latency spike traced multi-millisecond stalls to exactly this. Cutting the tcp_rmem maximum from 32 MiB took net_rx_action, the softirq loop from section 2.4, from 23 ms to 3 ms.
A socket can only have a receive queue once it exists, though, and a new TCP connection has to get through two other queues before your code is given its socket.
5.2The accept queue
Opening a TCP connection takes a three-message handshake. The client sends a SYN ("I'd like to connect"), the server's kernel answers with a SYN-ACK, and the client confirms with an ACK. Your application calls accept() to be handed the finished connection as a new socket. Two queues sit in between. Step through it:
The size of the accept queue comes from the number you pass to listen(fd, n), the backlog, and the kernel caps it at net.core.somaxconn, a system-wide setting. The SYN queue is bounded by the same backlog, and also by net.ipv4.tcp_max_syn_backlog. When the accept queue is full, Linux doesn't refuse new connections. It silently ignores their SYNs.
Your server calls listen(fd, 128), and a burst of 1,000 new connections arrives before it calls accept(). What do the clients that don't fit see?
?Why doesn't the kernel just refuse the connection?
Because a refusal is final, and a full queue is probably temporary. Dropping the SYN lets the client's normal retry logic try again a moment later, when there may be room.
Let's watch it happen on a tiny listener with a backlog of 4 whose application never calls accept(), and seven clients that connect one right after another. The timeline is simplified, but the counts match the real run that follows.
Now the same experiment for real, on Linux. The listing shows the heart of the program, leaving out the includes and the parsing of its two arguments, the backlog and the number of clients. It listens with the given backlog, never calls accept(), and opens that many non-blocking connections (O_NONBLOCK means connect() returns at once with EINPROGRESS, "still working", instead of waiting). The shell lines run it with a backlog of 4 and 20 clients. nstat -n resets the counters' baseline so that later output shows only what changed. ss -ltn lists listening TCP sockets with numeric ports, and ss -tan lists all TCP sockets, here filtered to connections whose destination port is 9000, which are the clients. The awk | sort | uniq -c tail counts them by state.
int ls = socket(AF_INET, SOCK_STREAM, 0);
sockaddr_in a{};
a.sin_family = AF_INET;
a.sin_port = htons(9000);
a.sin_addr.s_addr = htonl(INADDR_LOOPBACK);
bind(ls, (sockaddr*)&a, sizeof a);
listen(ls, backlog);                       // and then never accept()

for (int i = 0; i < clients; i++) {
    int c = socket(AF_INET, SOCK_STREAM, 0);
    fcntl(c, F_SETFL, O_NONBLOCK);
    connect(c, (sockaddr*)&a, sizeof a);   // EINPROGRESS
}
pause();nstat -n; ./backlog 4 20 & sleep 4
ss -ltn 'sport = :9000'
ss -tan 'dport = :9000' | awk 'NR>1{print $1}' | sort | uniq -c
nstat | egrep -i 'listen|syn'State Recv-Q Send-Q Local Address:Port Peer Address:Port
LISTEN 5 4 127.0.0.1:9000 0.0.0.0:*
5 ESTAB
15 SYN-SENT
TcpExtListenOverflows 60
TcpExtListenDrops 60
TcpExtTCPSynRetrans 45On a listening socket, Recv-Q is the current accept-queue length and Send-Q is the limit. The queue holds 5 against a limit of 4, as in our scene, because the check in include/net/sock.h is sk_ack_backlog > sk_max_ack_backlog, not >=. The same program on macOS 26.5.1 admitted exactly four. Below that, the five established connections and fifteen clients still in SYN-SENT (waiting for an answer to their SYN) account for all twenty.
Fifteen clients produced sixty overflows in four seconds: every SYN they sent, original and retransmit, counted once. The clients never see an error.
Retry timing has also changed over the years. On Linux 6.10 the stuck client's SYNs went out at 0, 1, 2, 3, 4, 5, 7, 11 and 19 seconds. If you learned "1, 3, 7, 15", you learned it before Linux 6.5 added tcp_syn_linear_timeouts (ccce324dabfe), whose first four retries are a flat second apart.
?Why doesn't the drop tracer see these drops?
Tracing the skb:kfree_skb tracepoint, the kernel's hook for "a packet was freed because it was dropped", is the standard way to find drops. In a ten-second run of the same backlog-4 program, it saw zero of the 105 refused SYNs. They all went through consume_skb instead, the call used for a packet that was delivered normally:
	case TCP_LISTEN:
		/* ... ACK, RST, SYN+FIN checks ... */
		if (th->syn) {
			/* ... */
			rcu_read_lock();
			local_bh_disable();
			icsk->icsk_af_ops->conn_request(sk, skb);   // may bump LISTENOVERFLOWS and bail
			local_bh_enable();
			rcu_read_unlock();

			consume_skb(skb);                            // either way: "consumed"
			return 0;
		}
That consume_skb is still there in v6.12, v6.15 and v6.17.
Raising the backlog helps you ride out bursts. somaxconn went from 128 to 4096 in Linux 5.4 (19f92a030ca6), and Cloudflare runs 16k (SYN packet handling in the wild). But a full accept queue usually means the application isn't calling accept() fast enough: a blocked event loop, a garbage-collection pause, a thread pool at its cap. That's the thing to fix.
The SYN reached the listening socket here, but on its way it already passed another part of the kernel that keeps a table of its own.
5.3The conntrack table
Back in section 3.3 the packet passed netfilter, where conntrack looked its flow up in a table. That table has a fixed size, and when it's full, as Cloudflare's Conntrack tales puts it, "packets creating new flows will be dropped. No questions asked." This is the failure that shows up in Kubernetes postmortems. Kubernetes is a system that runs containers across many machines, called nodes, in groups called pods, and each pod gets its own network namespace, a private copy of the network settings (chapter 11). Kubernetes gives each service a stable address and, in kube-proxy's iptables mode, implements it with NAT rules, so on such a node every packet goes through conntrack.
?Why do old connections keep working?
Because existing flows already have an entry, and only packets that would create an entry are dropped. So the symptom is new connections timing out while dashboards for established traffic look fine.
Its default size scales with RAM. On 64-bit hosts with more than 4 GB, nf_conntrack_max is 262,144 (nf_conntrack-sysctl.rst), and an 8 GB machine reads exactly that. Smaller nodes get smaller tables, which is how loveholidays hit it: they halved node RAM while connection counts doubled. Mark Betz's GKE incident, on Google's hosted Kubernetes, was a misbehaving CDN (content delivery network) flooding an RPC (remote procedure call) client through Linkerd, a proxy that runs next to each service.
So far every queue we've met fills because someone downstream is slow. The last one fills because the CPU that serves the ring is.
5.4One core pinned in softirq
All the softirq work we followed in sections 2 and 3 happens on a single CPU, the one that took the card's interrupt. When that CPU falls behind, frames wait in the ring, and when you use RPS or loopback, which we meet in section 6, they wait in the per-CPU backlog, a queue that each CPU keeps for its own softirq, 1,000 packets long by default (the netdev_max_backlog setting). Both overflow when the softirq can't keep up.
Cloudflare's How to receive a million packets per second is the classic example. A single-threaded UDP receiver got about 370k packets a second. The limit probably wasn't where you'd guess, because it wasn't the application. Every packet from one source hashed to one RX queue (a card can have several receive queues, each with its own ring and interrupt), so one CPU was "totally busy just reading the 350kpps."
?Why doesn't adding receiver threads help?
Because the bottleneck is the softirq on the CPU that owns the queue, and the threads reading the socket are idle most of the time. What helped was spreading flows across more RX queues, using SO_REUSEPORT for several receiving sockets (section 6), and keeping the receiver on the NIC's NUMA node, the group of CPUs that sits closest to the memory the card writes into (the wrong node cost up to 4 times). That got them to 1.4 million packets a second on one NUMA node.
You'll probably recognise it: mpstat -P ALL 1 shows one CPU at 100% %soft (time spent in softirq) and the rest idle. Virtual machines often have a virtual network card (virtio) with a single queue, and there you'll hit it early.
5.5ksoftirqd, and a fix reverted seven years later
Section 2.4 gave the softirq a budget so that it can't starve everything else. There's a second limit behind it. __do_softirq() gives up after 2 ms or 10 restarts (kernel/softirq.c) and hands the rest to the per-CPU ksoftirqd thread, which is scheduled like any other thread.
That handoff has been argued about for a decade:
- 2016, Linux 4.9. Eric Dumazet's "softirq: Let ksoftirqd do its job" (4cd13c21b207) stopped softirqs sneaking back in while
ksoftirqdran. Under a UDP flood, the receiving process went from "~2,000 packets per second" to "~900,000". - 2023, Linux 6.5. Paolo Abeni reverted it (d15121be7485) because deferring to a normal-priority thread caused "high latencies". The revert points to threaded NAPI (5.12) instead, which gives each NAPI instance its own kernel thread you can pin and prioritise.
If top shows ksoftirqd/N near 100%, the softirq budget on CPU N is permanently exhausted. It's the pinned core from section 5.4 under a different name.
5.6The map
That's the whole receive path, with a fixed-size queue at each hand-off. Here are the five lines in the order the packet meets them, with where each counts its drops. ethtool -S eth0 prints the card's own counters for the interface eth0, and dmesg prints the kernel's log. This is the table to keep open during an incident.
| Queue | Fills when | Where it's counted | Usual fix |
|---|---|---|---|
| RX ring | The CPU can't drain it fast enough | ethtool -S eth0 | Bigger ring, more RX queues (section 6) |
| Per-CPU backlog | Softirq processing falls behind (default 1,000 packets) | /proc/net/softnet_stat | Raise netdev_max_backlog, spread across CPUs (section 6) |
| Conntrack table | Too many tracked flows | dmesg: "nf_conntrack: table full, dropping packet" | Raise nf_conntrack_max |
| Socket receive buffer | Your app reads too slowly | nstat RcvbufErrors | Read faster, raise SO_RCVBUF |
| Accept queue | The app doesn't accept() in time | nstat ListenOverflows | Faster accept loop, bigger backlog |
The first fix in that table, and the one that matters most on a busy machine, is to stop using a single core.
06Using more than one core
Everything in sections 2 and 3 ran on the CPU that took the interrupt. On a busy server one CPU isn't enough, so Linux has four ways to spread the work, all documented in scaling.rst. They all rely on hashing: a function that turns a flow's 4-tuple into a number. Every packet of a flow gets the same number, so the whole flow stays on one CPU and its packets stay in order.
| Mechanism | Where it runs | What it does | Cost |
|---|---|---|---|
| RSS | The NIC | Hashes each flow's 4-tuple into one of several RX queues, each with its own IRQ (the interrupt line from the card to a CPU) | Free, but limited by the number of hardware queues |
| RPS | Software, on the receiving CPU | Hashes the packet and hands it to another CPU's backlog | An inter-processor interrupt (IPI, one CPU poking another) per batch |
| RFS | Software | Like RPS, but picks the CPU where the reading thread last ran | Same as RPS, plus a flow table |
SO_REUSEPORT | The socket layer (Linux 3.9, LWN) | Several sockets bind one port; each new flow is hashed to one of them | Uneven load if flows are uneven |
Which one should you reach for first? RSS, if the NIC has more queues than you're using (ethtool -l eth0). RPS when it doesn't: a VM with a single virtio queue reports Combined: 1, so every packet from outside lands on one CPU. And SO_REUSEPORT when the application itself is the bottleneck, with one accept loop.
Loopback is a special case. lo has no ring and no IRQ. Its transmit function drops each skb onto the current CPU's backlog, so loopback traffic shows up in softnet_stat. During one five-second run of iperf3, a standard network benchmark tool, the processed column rose by 2,397,701 while IpInReceives, the nstat count of IP packets received, rose by 2,397,255, which is the same traffic counted in two places.
That covers the way in. Your server also has to answer, and the reply travels through the same layers in the opposite direction.
07The way back out
7.1One write(), from your buffer to the wire
Sending uses the same layers in reverse, with one important difference: data waits in the socket until TCP decides it's allowed to send it. That decision involves three limits. The congestion window caps how many bytes TCP may have sent and not yet had acknowledged, and TCP adapts it to what the network seems able to carry. The receiver's window, which we met in section 5.1, caps the same thing from the other end. Pacing spreads the packets out in time instead of releasing them in a burst.
Our server has built its reply and calls write(). On the way out the reply meets two places that have no twin on the way in. One is the qdisc (queueing discipline), the queue in front of each network device whose policy decides which waiting packet leaves next; fq_codel and fq are the usual ones on a real card. The other is the TX ring, the transmit counterpart of the RX ring from section 2. Here is where the bytes go:
write() with its reply. The bytes are in your own buffer.?Why doesn't write() returning mean the data was sent?
Because write() only copies into the socket's write queue. Whether and when the bytes leave depends on TCP's windows, which depend on the network and the receiver. A successful write() means "the kernel has your data", nothing more.
Loopback skips the qdisc entirely. On Linux 6.10 tc -s qdisc show dev lo reports noqueue with 0 packets sent, even straight after three iperf3 runs have pushed about 250 GB through lo.
Look again at what the reply cost: one copy of the bytes, and a trip through every layer. When the data is a large file or the packets number in millions, both costs start to matter.
08Skipping copies, and skipping the stack
A normal write() copies once, from your program's own memory, called user space, into skb memory in the kernel. And every packet pays the full cost of the stack. Four features cut one or both:
| Feature | What it skips | Best for | Watch out for |
|---|---|---|---|
sendfile() | Copying file data through user space | Serving static files | Only file → socket |
MSG_ZEROCOPY (4.14) | The copy on send, by pinning your pages | Sends over about 10 KB | Completion bookkeeping; no gain on loopback |
| XDP | The whole stack: runs in the driver before any skb exists | Dropping floods of unwanted traffic, load balancing | No sockets, no TCP, BPF limits |
| AF_XDP (4.18) | The stack, delivering raw frames to a user-space ring | Custom packet processing | You rebuild what the stack did |
sendfile hands the page cache pages that hold a file's data (chapter 08) straight to the socket, using the frags[] array from section 3.1, so the bytes never pass through your program. It's how Netflix serves video, together with kernel TLS. TLS is the encryption under HTTPS, and doing it inside the kernel means the file's bytes can still go from the page cache to the socket without passing through the program. Drew Gallatin's 400 Gb/s talk is the reference (on FreeBSD; Linux got kTLS transmit in 4.13).
MSG_ZEROCOPY applies to data that's already in your own buffer. Instead of copying it, the kernel pins its pages, keeping them in place until the card has sent them, and tells you through a completion notification when you may reuse them. Pinning and notifying cost something too, which is why it only pays off for sends over about 10 KB.
?Why didn't MSG_ZEROCOPY help on loopback?
In a test, every one of 64 one-megabyte sends came back flagged SO_EE_CODE_ZEROCOPY_COPIED. The kernel doc explains it: anything "looped to a local socket will incur a deferred copy". You pay for the pinning and the notification and still get the copy.
XDP skips the most. It runs in the driver's poll, on the raw DMA buffer, before the skb is allocated, so a program can drop or forward a packet before the stack has spent anything on it. The CoNEXT 2018 paper reports single-core processing "as high as 24 million packets per second". Cloudflare runs its DDoS (distributed denial-of-service, a flood of traffic meant to knock a server over) drops there (L4Drop), and Facebook's Katran load balancer, which spreads connections across servers by looking only at IP and TCP headers, does the same. When you need more logic than an XDP program allows, AF_XDP hands the raw frames to a ring in user space, and you rebuild whatever the stack would have done. How XDP programs are checked for safety and run is covered in chapter 48, eBPF.
Last, busy polling. SO_BUSY_POLL (3.11) lets a thread in recv() spin on the NAPI queue itself instead of sleeping until the softirq wakes it. It trades a burnt core for fewer wake-ups. The newer knobs are in napi.rst.
Whether any of this is worth the trouble depends on what a packet costs, so let's put numbers on it.
09What a packet costs
9.1Loopback throughput by write size
A loopback connection has no card and no wire, so it shows the kernel's own cost. The numbers below come from one sender thread and one reader thread on a loopback TCP connection, with a fixed write size per run. A Linux virtual machine on a shared host understates what the kernel can do, so treat the Linux column as a floor. The exact values vary between machines, and the shape is what carries over.
| write() size | Linux 6.10 (VM) | ns per write | macOS 26.5.1 | ns per write |
|---|---|---|---|---|
| 64 B | 0.26 GB/s | 244 | 0.14 GB/s | 446 |
| 1 KB | 3.68 GB/s | 278 | 1.76 GB/s | 581 |
| 16 KB | 19.1 GB/s | 857 | 8.27 GB/s | 1,980 |
| 128 KB | 22.2 GB/s | 5,919 | 17.7 GB/s | 7,409 |
| 1 MB | 25.0 GB/s | 41,879 | 21.1 GB/s | 49,772 |
From 64 bytes to 1 KB the time per call barely moves, so small writes pay a fixed cost of about 250 ns each on Linux: the syscall, the socket lock and skb allocation. Past 16 KB the copy dominates and throughput flattens. So batch small writes, and most of that fixed cost disappears.
iperf3 reached a median of 142 Gbit/s on the same loopback. Loopback is closer to a memcpy with a TCP state machine attached than to a network.
9.2The per-packet budget on a real NIC
Loopback hides the number that matters on real hardware: packets per second. Here's the arithmetic for 10 GbE with minimum-size frames, the same figure we used in section 2.1 (Mpps means millions of packets per second):
| Wire bits per minimum frame | (64 B frame + 20 B preamble and gap) × 8 | 672 bits |
| Line rate at 10 Gb/s | 10e9 / 672 | 14.88 Mpps |
| Time budget per packet | 1 / 14.88M | 67 ns |
| Full stack, one core (Cloudflare 2015) | 1 / 370k–430k pps | 2.3–2.7 µs |
| XDP, one core (CoNEXT 2018) | 1 / 24M pps | ≈ 42 ns |
| Cores the full stack needs for 10 GbE line rate, small packets | ≈ 35–40 | |
There's a small puzzle hiding in those loopback runs. Each of three iperf3 runs on the shared VM reported retransmits (16, 75 and 19), though loopback can't lose packets. The counters say the re-sends were spurious, meaning the originals had arrived: TcpRetransSegs (segments re-sent) roughly matched TCPDSACKRecv (the receiver saying "I already had that"), and tail-loss probes fired, which are TCP's early re-sends of the last segment when an ACK is slow. The likely cause is the receiving thread being descheduled on a shared machine, so that its ACKs arrive after the probe timer has gone off. If you want to settle it, pin both threads to idle CPUs on a dedicated machine and see whether the retransmits go away.
10Watching it on a real machine
10.1Where each drop is counted
Each question this chapter raised has a tool that answers it on a running machine.
# Is the NIC dropping, and does it have more than one queue? (sections 2 and 6)
ethtool -S eth0 | grep -iE 'drop|miss|err|xdp'
ethtool -l eth0            # how many RX/TX queues. "Combined: 1" means no RSS
ethtool -g eth0            # ring size; -G to grow it

# Is a CPU falling behind its softirq budget? (sections 2.4 and 5.4)
cat /proc/net/softnet_stat   # col1 processed, col2 dropped, col3 time_squeeze
mpstat -P ALL 1            # %soft column: is one CPU drowning in softirq?

# Is a listener overflowing, or a socket buffer full? (sections 5.1 and 5.2)
nstat | grep -E 'ListenOverflows|ListenDrops|RcvbufErrors|TCPBacklogDrop|PruneCalled'
ss -ltn                    # on LISTEN rows: Recv-Q = queued, Send-Q = limit

# One connection, in detail (sections 5.1 and 7)
ss -tin 'dport = :443'     # rtt, cwnd, retrans, rwnd_limited, dsack_dups

# Is conntrack close to full? (section 5.3)
cat /proc/sys/net/netfilter/nf_conntrack_{count,max}
dmesg | grep 'table full'
The 6.10 softnet_stat layout is in net/core/net-procfs.c. Older guides, including packagecloud's excellent Monitoring and Tuning the Linux Networking Stack, describe column 9 as cpu_collision; it's always 0 now.
10.2Tracing drops
For drops that go through kfree_skb, drop reasons turn a count into a location:
# Counts drops by function and reason code
bpftrace -e 'tracepoint:skb:kfree_skb { @[ksym(args->location), args->reason] = count(); }'

# Or the older tool
dropwatch -l kas
Reason codes are listed in include/net/dropreason-core.h; SOCKET_RCVBUFF, SOCKET_BACKLOG, CPU_BACKLOG and PROTO_MEM are the ones you'll see under load. Two cautions. The tracepoint fires for every network namespace on the machine, so on a host full of containers you should filter on a port. And it never sees listen overflows (section 5.2).
10.3Rules that hold up
- Find the counter before you touch a setting. Every queue in section 5.6 has one, and a sysctl change with no moving counter behind it is a guess.
- Fix the accept loop before raising the backlog. A full accept queue means your application isn't calling
accept()fast enough. - Size UDP buffers by
truesize. A 100-byte datagram costs about 830 bytes of buffer, andrmem_maxhas to be raised too. - Alert on
nf_conntrack_countagainstnf_conntrack_maxwell before 100%, and fix it on the node, not in the pod. - Spread receive load in order: RSS, then RPS, then
SO_REUSEPORT. - Batch small writes. Each
write()pays about 250 ns before any data moves. - Don't trust a drop tracer for listen overflows. Read
nstatandss -ltninstead.
10.4What you trade for what
| You get | You pay | When the bill arrives |
|---|---|---|
| NAPI polling instead of an interrupt per packet | A softirq that can run out of budget | As time_squeeze climbing, or ksoftirqd at 100% |
| A bigger accept backlog | A slow accept loop stays hidden | As clients waiting seconds with nothing in your logs |
| Bigger socket buffers | Memory, and work in the softirq to compact them | As multi-millisecond latency spikes on TCP |
| Conntrack for NAT and stateful firewalls | A fixed-size table shared by the whole node | As new connections timing out while old ones work |
| RPS and RFS on a one-queue NIC | An IPI per batch, and a flow table | As CPU spent on inter-processor interrupts |
| Busy polling | A core spinning | As a core you can't use for anything else |
| XDP | No sockets, no TCP, and BPF's limits | As having to rebuild whatever the stack did for you |
10.5Symptom, cause, fix
| Symptom | Likely cause | Fix |
|---|---|---|
| New connections time out; logs show nothing | Accept queue full | Speed up the accept loop, then raise the backlog and somaxconn |
| New connections fail on one node; old ones fine | Conntrack table full | Raise nf_conntrack_max on the node, shorten timeouts, notrack stateless traffic |
One CPU at 100% %soft, others idle | All traffic on one RX queue | More queues (ethtool -L), RSS, then RPS, then SO_REUSEPORT |
time_squeeze climbing | Softirq budget exhausted | Raise netdev_budget, or threaded NAPI on dedicated cores |
| UDP messages lost, sender sees no error | Receive buffer full | Read faster, raise SO_RCVBUF and rmem_max |
| Multi-millisecond latency spikes on TCP | Oversized receive buffers collapsing | Lower the tcp_rmem maximum |
11Summary
- The stack is a chain of queues. Ring, backlog, conntrack, socket buffer, accept queue: each has a fixed size, and each drops when full.
- The CPU doesn't see a packet until the softirq. The NIC writes it into RAM itself, and NAPI polls in batches instead of taking an interrupt per packet.
- Softirq work has a budget. 300 packets or 2 jiffies per run; running out shows up as
time_squeeze. - An skb points at a packet; it doesn't hold it. Sockets are charged
truesize, about 830 bytes for a 100-byte UDP datagram. - UDP loses data the sender can't see. Check
UdpRcvbufErrorsfirst. - A full accept queue drops SYNs silently. Clients retry after about a second, your logs show nothing, and drop tracers miss it;
nstatdoesn't. - Conntrack exhaustion is node-wide. New flows fail while existing ones work, and a pod can't fix it.
- One busy softirq pins one core. Spread load in order: RSS, then RPS, then
SO_REUSEPORT. write()returning means the kernel has your data, not that it was sent.- The full stack costs microseconds per packet. Line rate with small packets needs XDP. That's why DDoS mitigation lives there.
12Build this
A drop census for one machine.
- Write a script that snapshots
ethtool -S,softnet_stat,nstat -azand the conntrack count, then diffs two snapshots and prints only what moved. - Break the box five ways and check your script catches each: the backlog-4 server from section 5.2, the UDP flood from section 5.1, iperf3 with RPS off and then on,
tc qdisc add dev lo root netem loss 5%, and a conntrack table filled by short connections in a throwaway VM. - Run the same five with a
kfree_skbbpftrace alongside, and note which ones the tracer misses. You should find at least one.
13Interview questions
beginnerWhat's the difference between the SYN queue and the accept queue?›
A SYN queue holds half-open connections: SYN received, SYN-ACK sent, waiting for the final ACK. The accept queue holds completed connections waiting for accept(). Both are limited by the listen() backlog, which net.core.somaxconn caps, and the SYN queue also by net.ipv4.tcp_max_syn_backlog. When the accept queue is full, Linux drops incoming SYNs and counts them in ListenOverflows and ListenDrops.
beginnerWhat does NAPI do, and why does it exist?›
It switches a busy NIC from interrupt-per-packet to polling. The first packet raises an IRQ, the driver masks further interrupts and schedules a softirq that polls the ring, up to a budget (300 packets or 2 jiffies per run by default). Interrupts are re-enabled only when the ring is empty. Without it, a high packet rate becomes an interrupt storm and nothing else runs.
intermediateYour UDP service loses messages but the sender sees no errors. Where do you look?›
nstat for UdpRcvbufErrors. The receive buffer is full, and sendto() succeeds regardless. The socket is charged truesize: in the experiment in section 5.1, a 100-byte datagram cost about 830 bytes of buffer. Raise SO_RCVBUF (and rmem_max, or the request is capped), read faster, or spread load with SO_REUSEPORT.
intermediateRSS, RPS and RFS: what does each do?›
RSS is the NIC hashing flows into multiple hardware queues with separate IRQs. RPS is the same hash done in software by the receiving CPU, which hands the packet to another CPU's backlog via IPI. RFS extends RPS to pick the CPU where the consuming thread last ran, for cache locality. RSS is free but limited by queue count; RPS and RFS cost an IPI and some CPU.
intermediateA Kubernetes node starts timing out new connections; existing ones are fine. First guess?›
Conntrack. When the table's full, packets that would create a new entry are dropped while established flows keep matching existing entries. Check dmesg for "nf_conntrack: table full" and compare nf_conntrack_count to nf_conntrack_max. It's node-wide, so the fix happens on the node.
deepWhy might dropwatch show nothing during a SYN flood that's overflowing your accept queue?›
In v6.10 (and through v6.17), tcp_rcv_state_process() hands the SYN to tcp_conn_request(), which records the overflow and returns, and then frees the SYN with consume_skb(), not kfree_skb(). Drop tracing hooks kfree_skb. In a ten-second test the counters showed 105 listen overflows in nstat, zero matching kfree_skb events, and 110 matching consume_skb events.
deepWhen does MSG_ZEROCOPY make things slower?›
Below roughly 10 KB per send, where pinning pages and processing completion notifications cost more than the copy (the kernel doc's own guidance). And on loopback or to any local socket, where the kernel does a deferred copy anyway: 64 of 64 one-megabyte sends came back flagged SO_EE_CODE_ZEROCOPY_COPIED.
deepWhere does XDP run relative to the rest of the stack, and what do you lose?›
In the driver's NAPI poll, on the raw DMA buffer, before an skb is allocated, so before GRO, tc, netfilter and sockets. That's why it can drop or forward tens of millions of packets per second per core. You lose everything above it: no conntrack, no TCP, no socket lookup, and the BPF verifier's limits apply. AF_XDP hands frames to user space when you need more logic.
14Go deeper
listen(fd, 4) and no accept(). How many connections complete on Linux 6.10?›
Five. The full check is sk_ack_backlog > sk_max_ack_backlog, so the queue
holds backlog + 1. macOS admitted four in the same test.
softnet_stat column 3 is climbing. What does it mean?›
time_squeeze: net_rx_action ran out of budget (packets or time) with work still queued. The CPU isn't keeping up with its RX queues.
You set SO_RCVBUF to 64 KB. What does getsockopt return?›
128 KB. The kernel doubles the value to allow for skb overhead, subject to rmem_max.
Why does loopback traffic show up in /proc/net/softnet_stat?›
lo's transmit queues the skb on the per-CPU backlog, and process_backlog delivers it like any other NAPI instance.
The introduction to distributed systems starts from unreliable messages, sockets, acknowledgements and timeouts, which is the problem TCP solves for every program. Free online at ostep.org.
Joe Damato, 2016, in two parts. The most complete walk through the receive path at source level; check the column layouts against a newer kernel.
RSS, RPS, RFS, accelerated RFS and XPS, from the people who wrote them, with the configuration for each.
Both listen queues, the counters, and syncookies, with production numbers.
The design paper for XDP, with benchmarks against DPDK (a library that takes the card away from the kernel entirely) and the normal stack.
15Related chapters
Where XDP and the drop tracing in this chapter come from: the verifier, maps, helpers and attach points. Chapter 48.
Top halves, bottom halves and the per-call cost behind the 250 ns floor in section 9. Chapter 07.
Network namespaces and veth pairs, which give each container its own copy of the network stack described here. Chapter 11.
What sits in front of these listeners, and how L4 balancers like Katran use the fast path. Chapter 34.