You've written a small program, thumbnail.py. When a photo is uploaded, it shrinks the photo and saves the thumbnail to S3, Amazon's file-storage service. It works on your laptop. Now it has to run somewhere else, every time a photo arrives, and you find that "run this somewhere" has half a dozen answers: rent a whole server, rent a virtual machine, put the program in a container, upload it as a function, or hand it to Kubernetes as a pod.
Choosing is a bit like finding a place to live. Buy a house and you have everything to yourself, and it takes months. Rent a flat and you share the building, and it takes days. Book a hotel room and you're in tonight, with less control. Take a taxi and you own nothing, arrive in minutes, and pay only for the ride. Each step gives up some control for speed of getting started. Compute has the same ladder, and the price of climbing it is paid in how long the first request has to wait (its latency) and in how much of the machine you can no longer see.
This chapter follows thumbnail up the ladder and asks three questions the whole way. What am I renting at each rung? How long does the first photo wait before its thumbnail is made? And who decides which machine runs my code? We start by timing how long it takes to start something on your own computer, then see what each rung hides, take apart a function's cold start (the extra wait when a request arrives and nothing is ready to serve it), and finish by watching Kubernetes pick a machine for your code.
01Timing three ways to start something
1.1A process, a process in a container, a whole container
Before comparing rungs, you can feel the cost of climbing one. We'll start the smallest possible program three ways and time each. The program is /usr/bin/true, which does nothing and exits at once, so whatever time we measure is the cost of starting it and nothing else.
The three ways are these. First, run it directly as a process, a running program, on your own computer. Second, run it inside a container that's already running. A container is a program that has been given its own private view of the machine's files, processes and network, so it behaves as though it has the machine to itself; Docker is the usual tool for making one, and section 2 explains how it works. The command for this is docker exec warm true. Third, create a brand-new container just to run true, with docker run --rm alpine true. Here alpine is the name of a tiny packaged Linux, called an image, that the container is made from, and --rm deletes the container when the command exits.
The script runs each command 20 times and prints the median, the middle value, which a few unusually slow runs can't distort. Save it as startup.py. The second code block starts the container named warm (with -d, so it keeps running in the background, sleeping for 600 seconds) and then runs the script, so run those two lines first.
import statistics, subprocess, time

def median_ms(cmd, n=20):
    times = []
    for _ in range(n):
        t = time.perf_counter()
        subprocess.run(cmd, stdout=subprocess.DEVNULL, check=True)
        times.append((time.perf_counter() - t) * 1000)
    return statistics.median(times)

print(f"start a process on the host        (/usr/bin/true)              : {median_ms(['/usr/bin/true']):8.1f} ms")
print(f"start a process in a running container (docker exec)            : {median_ms(['docker', 'exec', 'warm', 'true']):8.1f} ms")
print(f"start a whole new container (docker run --rm alpine true): {median_ms(['docker', 'run', '--rm', 'alpine', 'true']):8.1f} ms")docker run -d --name warm alpine sleep 600 # the running container used by the second line
python3 startup.pystart a process on the host (/usr/bin/true) : 1.4 ms
start a process in a running container (docker exec) : 56.3 ms
start a whole new container (docker run --rm alpine true): 178.0 msStarting a process on the host took 1.4 ms. Starting a process in a container that was already running took 56.3 ms, and creating a whole new container took 178.0 ms. Running the script again gives numbers like 53.1 and 176.0 ms for the last two, so expect the first row to be stable and the other two to wobble by a few milliseconds.
1.2Reading the numbers with care
This isn't a clean comparison. On a Mac or Windows machine, Docker runs containers inside a Linux virtual machine (a simulated computer with its own operating system, which section 2 explains), so the container timings include a call from the Docker command to a background service and into that virtual machine, and the plain process doesn't. (On Linux there's no virtual machine in between.) The gap between the two container rows is the more trustworthy part: building a new container from scratch costs about 120 ms more than starting one more process in a container that already exists.
That's the pattern the ladder predicts. Each abstraction wraps another, and starting a higher-level thing means setting up more layers around the same tiny program. To know what we're paying for, we need to name the layers and say what each one gives us.
02What you rent at each rung
The three timings differ because each one builds more machinery around true. So let's build up the layers the way a cloud provider would, starting from the bottom and adding one each time the previous one runs into a problem.
2.1From a whole server to a function
The lowest rung is bare metal: you rent a whole physical server and manage everything from its firmware (the software built into the hardware that starts it up) upward. Nothing is hidden from you and nothing is shared, and getting one takes minutes to hours.
Everything running on a server leans on one program, the kernel. The kernel is the core of the operating system: it controls the hardware, decides which program runs when, and hands out memory, files and network connections when programs ask. Two programs on the same machine share its kernel. That's fine for your own programs, but cloud providers make money by cutting one big server into many small pieces and renting them to different customers, and a bug in one customer's program must not reach another's.
One fix is to give every customer their own kernel. A hypervisor is software, helped by features in the CPU, that makes one physical machine look like several separate computers. Each of these is a virtual machine, or VM, and runs its own kernel and operating system, called the guest. The wall between two customers is the hypervisor, whose job is narrow and well guarded. Amazon's EC2 and Google's Compute Engine (GCE) rent these out. The price is that every VM has to boot an entire operating system before it can do anything, which takes tens of seconds.
The opposite fix is to share one kernel and make it hide things. A container is an ordinary process (or group of them) that the kernel restricts in two ways. Namespaces give it a private view: its own list of processes, its own files, its own network. Cgroups (control groups) cap how much CPU and memory it can use. A container starts in tens of milliseconds because the kernel is already running and only has to set up the restrictions. The price is that every container on the machine shares one kernel, so the wall between two customers is the kernel's own interface, and a bug in the kernel can let code escape its container. Chapter 11 builds a container by hand.
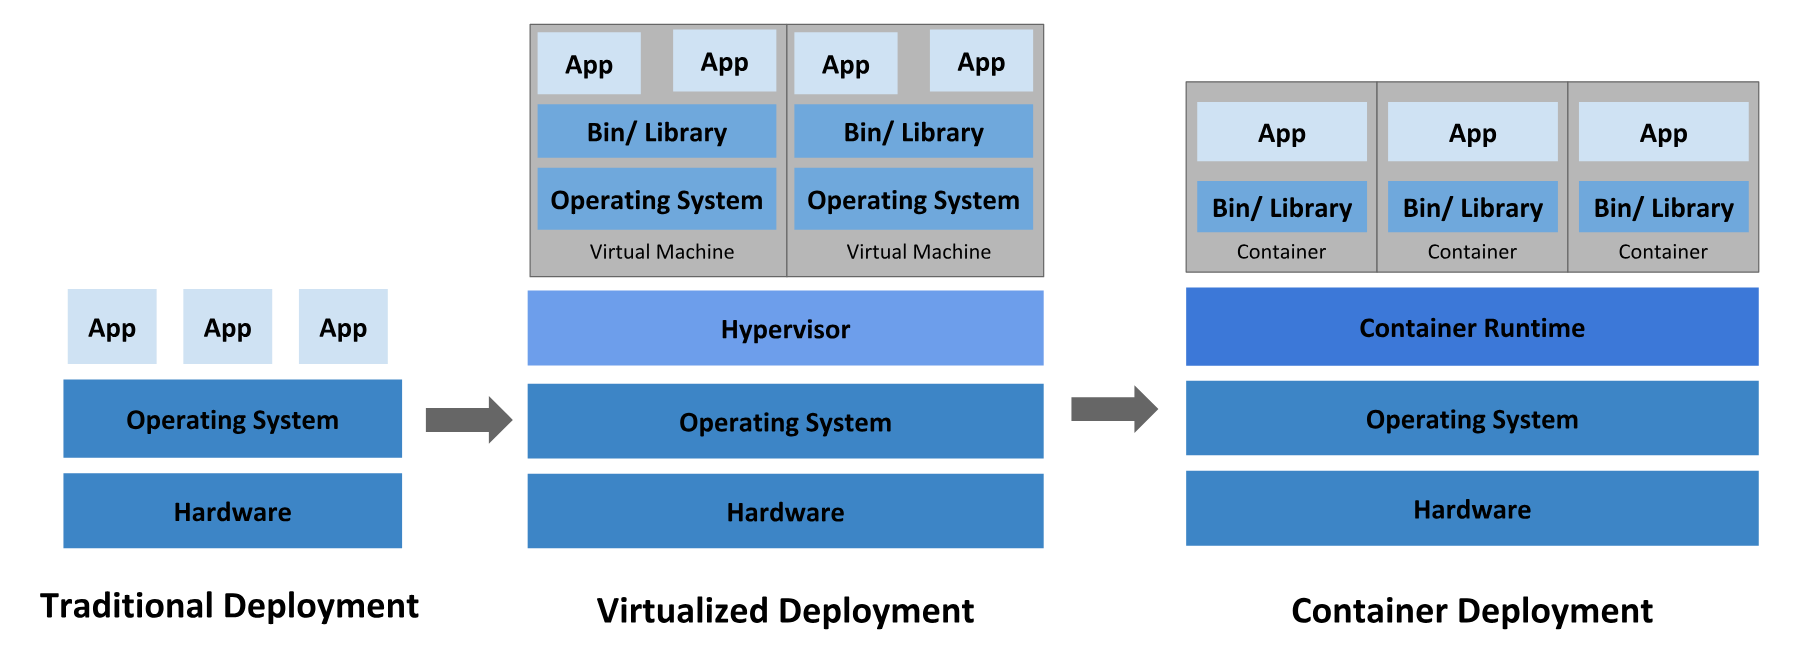
Between the two sits the microVM: a VM with nearly everything trimmed away, so that it still has its own kernel but boots in a fraction of a second. Firecracker, built by AWS (Amazon Web Services, Amazon's cloud), is the best-known one, and section 5 shows what it leaves out.
At the top, you stop thinking about machines at all. A function is the platform's offer to take only your handler, the piece of code that answers one request, and decide for you when to start somewhere to run it. You are billed for the milliseconds it runs. AWS Lambda, the most-used function platform, runs each function inside a microVM. Here are the rungs side by side:
| Rung | Isolation boundary | You manage | Time to a new one | Billed by |
|---|---|---|---|---|
| Bare metal | A physical machine | Everything from firmware up | Minutes to hours | The month or hour |
| VM (EC2, GCE) | A hypervisor; your own kernel | The guest OS and up | Tens of seconds | The second, with a 60-second minimum on EC2 Linux (2017) |
| microVM (Firecracker) | A minimal hypervisor; your own kernel | Usually nothing: a platform runs it for you | Under 125 ms until the guest's first program starts (NSDI 2020) | Whatever the platform on top charges |
| Container | Namespaces and cgroups; a shared kernel | The image and up | Tens of milliseconds (runc run took 48 ms in chapter 11), plus the image pull | The node it runs on |
| Function (Lambda) | A microVM per execution environment | Your handler | As little as 50 ms (Brooker et al. 2023); seconds for heavy runtimes | The millisecond, since December 2020 |
Each lower rung's mechanics have their own chapter. Chapter 47 covers how a hypervisor traps a guest and what each exit costs, and chapter 11 covers how namespaces, cgroups and overlayfs (the layered filesystem containers use) make a container. This chapter treats the rungs as products: what they promise and what they charge.
?Why not always pick the top rung?
Because each rung up trades control for convenience, and the price of that trade is paid in latency you can't see coming. A function costs nothing while it's idle, but the platform decides when to throw away the process you've already started, and the next request pays to start a new one. A container starts fast, but it shares a kernel with its neighbours.
A long-running service with steady traffic gets little from a function's scale-to-zero (paying nothing while nobody calls it) and pays for every cold start. A burst of short, unrelated jobs gets a lot.
2.2Two questions that pick the rung
Most choices come down to two questions.
- Whose kernel is it? If you don't trust your neighbours, or they don't trust you, you want a separate kernel per tenant. That's a VM or microVM. A container's boundary is the shared kernel's syscall surface, meaning the set of requests a program can make to the kernel.
- Who keeps it warm? If you keep processes running, you pay for idle time but never wait for a start. If the platform keeps them, you pay only for work, and sometimes wait.
The top rung hides the most, which means it's also the one where you can least see what happens between a photo arriving and your handler running. That gap is where cold starts live, so we'll look inside it.
03What happens when a function is called
Lambda is the most-used function platform, and AWS documents its lifecycle in unusual detail, so it's the clearest place to watch what "serverless" does between a request and your handler. Say you've uploaded thumbnail to Lambda as a function, and a photo arrives.
3.1Init, Invoke and Shutdown
Lambda doesn't keep thumbnail running while it waits for photos. When one arrives, it runs your code in an execution environment, one microVM set up for your function. Inside it are three things. The runtime is the program that runs your language, such as CPython, the JVM or Node. Next to it is your code. And there may be extensions, optional helper programs for things like monitoring. An internal extension runs inside the runtime's own process, and an external one runs as a separate process beside it. Each environment handles one request at a time. (The newer Lambda Managed Instances, which run on EC2 virtual machines in your own account and take several requests at once, have a different lifecycle.)
An environment's life has three phases, per the lifecycle docs. Init builds the environment and runs your static code, meaning everything in your file outside the handler. For thumbnail that's importing boto3 (the library for talking to AWS), creating the S3 client, and making an ID prefix that it stamps on the name of every thumbnail. Invoke calls your handler, the function that answers one request. Shutdown ends the environment. Between invocations, Lambda freezes the environment so it uses no CPU while it waits.
Here's thumbnail handling three photos. Watch the environment move through the phases, and notice which requests have to wait.
thumbnail. Nothing is running for this function yet, so the request has to wait while Lambda builds somewhere to run it.A few details from the same page change how you write the code:
- Frozen means frozen. Background threads and callbacks that didn't finish before the handler returned resume on the next thaw, possibly minutes later.
/tmpsurvives. It's 512 MB to 10,240 MB, and it keeps its contents across invocations in one environment. It isn't wiped even when a failed invoke resets the environment.- No environment lives forever. Lambda "terminates execution environments every few hours" for maintenance, even under continuous traffic.
- A crash costs you an Init. If the handler crashes or times out, Lambda resets the environment and runs Init again on the next request, a suppressed init that doesn't get its own log line.
- Extensions get a little time to finish at Shutdown. An external extension, a separate process, gets 2,000 ms to send off whatever it has buffered, and an internal one gets 500 ms. Anything still running after that is killed.
Everything in the picture happened somewhere, and something decided to build the environment and chose where. That decision is the part of the cold start you never see.
3.2One cold invoke, end to end
The Lambda paper by Brooker, Danilov, Greenwood and Piwonka (USENIX ATC 2023, arXiv) describes the invoke path. Here's what happens to photo 1 when no warm environment exists, as messages between the machines involved. (The paper calls an execution environment a sandbox, so "start sandbox" below means "create an environment".)
On a warm invoke the Worker Manager already knows a free environment, and everything from "start sandbox" to "Init" is skipped. Notice the phrase "loaded lazily" on the microVM's second disk. It hides a real problem, because the code that disk holds can be enormous.
3.3Loading a 10 GiB image in milliseconds
When Lambda launched, functions were zip files of up to 250 MB, downloaded and unpacked in full before the microVM could do anything. Then Lambda began accepting container images, a function's code and libraries packaged as a complete filesystem, of up to 10 GiB. Downloading 10 GiB before every cold start would make cold starts take minutes, so the paper's system loads images a block at a time, on demand.
?How can a 10 GiB image start in tens of milliseconds?
Because almost none of it is read at startup. Brooker et al. cite Harter et al.'s finding that "on average only 6.4% of container data is needed at startup." So Lambda flattens each image into one filesystem, cuts it into fixed 512 KiB chunks, and fetches a chunk only when the guest first reads from it.
The guest sees an ordinary virtual disk. Behind it, a per-function agent on the worker answers each read from the nearest place that has the chunk. Here are two reads of thumbnail's image, one from the shared cache and one that has to go to the origin:
thumbnail image is 10 GiB, mostly files it never touches. Lambda has cut it into 512 KiB chunks held in S3, the origin (the original copy), and a shared cache for the whole availability zone (AZ, one group of data centres in a region) already holds chunk 41. Nothing has been downloaded to this worker.The three tiers, in the order a read tries them:
| Tier | Share of chunks served | Latency from the worker |
|---|---|---|
| Per-worker local cache | 67% (median, one week, one large region) | Local |
| AZ-level distributed cache | 32% | Median 550 µs, p99.9 3.7 ms |
| S3, the origin | 0.06% | Median 36 ms, p99.9 175 ms |
Two design choices make those hit rates possible:
- Deduplication without shared keys. Each chunk is encrypted with a key derived from its own SHA-256 hash (convergent encryption), so identical chunks from different customers become identical ciphertext and are stored once. About 80% of newly uploaded functions had zero unique chunks, mostly re-uploads from automated build systems; of the rest, the median upload was 2.5% unique.
- Erasure coding in the cache. Chunks are stored in the AZ cache as a 4-of-5 code, meaning each chunk is split into five stripes of which any four rebuild it. A reader asks for five stripes and reconstructs from the first four, which costs 25% more storage and requests but cuts tail latency (the slowest few reads) and hides a failed cache node without retries.
With the code arriving lazily and from nearby, the platform's share of the cold start is small. What's left is mostly Init, which is your code, so the next question is how long that takes.
04What a cold start is made of
"Cold start" gets used for any slow first request, and it's more useful to split it into the parts we've just met, because each part has a different owner and a different fix.
4.1The pieces, in order
A cold start for thumbnail has six pieces, in this order. The platform finds a server with room (placement), gets the code onto it (fetch), and either boots a microVM or brings back a saved copy of one, called a snapshot (section 5). Then the runtime starts, your static code runs, and finally the first request meets whatever your code was too lazy to set up earlier: the first connection to open, the first cache to fill.
The platform owns the first three. You own the last three, and the Lambda docs say plainly which one dominates: "The largest contributor of latency before function execution comes from initialization code."
4.2Measuring the pieces you own
To see the size of the pieces you own, here's the cost of starting processes that do progressively more before they're ready. The row "imports boto3 and creates an S3 client" is exactly what thumbnail's Init does. The first two columns come from a small 4-CPU Linux virtual machine running on a Mac, and the third from the Mac itself. The two Linux columns differ only in where the Python packages live. In the first, the virtual environment (a folder of installed Python packages) sits on the Linux VM's own disk. In the second, it sits in a folder the Mac shares into the VM. The two java rows compare the JVM's default, which loads its standard classes from a prebuilt archive (class data sharing), with the same program when the archive is switched off.
Each figure is the median of 21 runs, and the VM shared its CPUs with other busy work, so the spread between runs was wide. The milliseconds will be different on your machine; the ratios between rows are what carry over.
| Start a new process that… | Linux VM, packages on its own disk | Linux VM, packages on a share from the Mac | macOS |
|---|---|---|---|
| exec /bin/true | 0.3 ms | 0.3 ms | 2.5 ms |
| runs python3 -S -c pass | 5.8 ms | 6.0 ms | 18.6 ms |
| runs python3 -c pass | 7.8 ms | 9.8 ms | 25.8 ms |
| imports json | 12.4 ms | 17.4 ms | 28.7 ms |
| imports boto3 | 126 ms | 252 ms | 187 ms |
| imports boto3 and creates an S3 client | 182 ms | 1,040 ms | 277 ms |
| java -version (class data sharing on) | 18.2 ms | — | — |
| java -version -Xshare:off | 35.0 ms | — | — |
| is forked from a parent that already did all of the above | 0.58 ms | 0.58 ms | 1.50 ms |
Read down the first column. An empty program starts in 0.3 ms, the Python interpreter alone adds a few milliseconds, and importing boto3 and building one S3 client brings thumbnail to 182 ms. Nothing about the photo has been touched yet, and almost all of the time goes to getting ready.
?Why did the same code take almost six times longer on one disk?
The middle column ran the same virtual environment from /scratch, a directory shared in from the Mac host, where every metadata operation (listing a directory, checking a file) crosses the VM boundary and is slow. Creating one S3 client there spends roughly 65% of its time in listdir(), the call that lists a directory. botocore, the library underneath boto3, ships a description of every AWS service as files in its own folders, and to find S3's it calls listdir() 895 times and stat() (which reads one file's details) 2,777 times.
That's a cold start in miniature. The interpreter's own start barely moved between the two columns. What changed was the cost of your code's file access pattern, thousands of small lookups, on a disk where each lookup is slow. A Lambda function reading its code from a lazily loaded disk (section 3.3) is in the same position, and that's the effect the chunk caches, and the prefetching in section 5.3, exist to hide.
There's a second lesson in the last row. fork() is the system call that makes a copy of a running process, memory and all. A copy made from a parent that has already done the imports is ready in well under a millisecond, roughly 300 times faster than repeating the init. If a platform could do that for a whole machine, Init would disappear from the cold start, and that is what a snapshot does.
05Starting from a snapshot instead of booting
A forked process is a copy of something that's already initialised. For a function, the thing to copy is a whole machine, which takes two ingredients: a machine that's cheap to create, and a way to save one in the middle of its life and bring copies back.
5.1What a microVM leaves out
A VMM (virtual machine monitor) is the program that creates and runs a VM. A general-purpose one such as QEMU emulates a whole PC, down to its old hardware: a BIOS, PCI buses, USB, a floppy controller. Firecracker emulates almost nothing. It offers a virtual network card and a virtual disk (both built on virtio, a standard for simple virtual devices), a serial console and a keyboard controller used only to reset the guest, and it boots a Linux kernel directly.
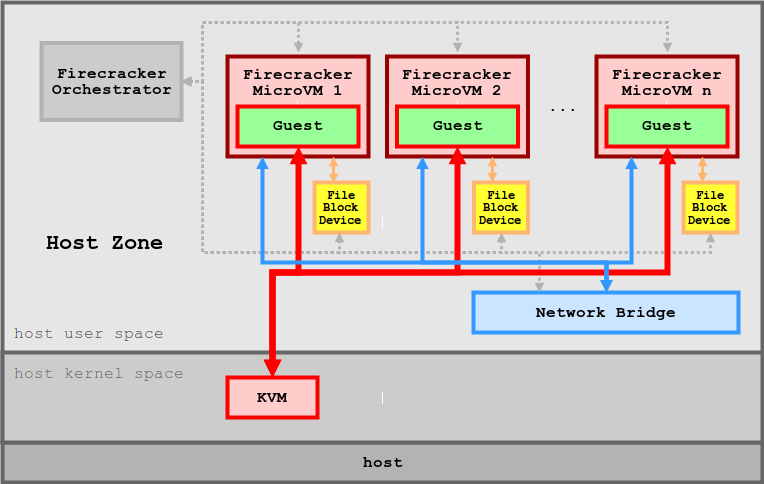
With so little to set up, a Firecracker microVM gets from "start" to running the guest's first program (Linux calls it init) in under 125 ms, and it costs about 3 MB of memory on top of what the guest itself uses. Chapter 47, section 8.4 has the full table from the NSDI paper, including the I/O throughput it gives up.
?If a microVM boots in 125 ms, why are cold starts ever slow?
Because the kernel is probably the smallest part of what has to start. After the guest kernel comes the language runtime, then your code, then everything your code does before it can serve a request. For a Java app that loads a framework, Init can run for seconds (SnapStart's launch example, in section 5.4, took over 6), so a 125 ms guest boot is a small slice of the wait.
So the platforms stopped booting. They snapshot a machine that has already booted and initialised, then restore copies of it.
5.2A snapshot is a paused machine in a file
A Firecracker snapshot has three parts, per its snapshot docs: the guest memory file, the microVM state file (the CPU registers and device state of the paused machine), and any disk files, which you manage yourself.
What's interesting is how memory comes back. You'd expect the restore to read the whole memory file into RAM. Firecracker maps it instead, using mmap, a system call that makes a file appear as a region of the program's memory without reading it:
/// Creates a GuestMemoryMmap given a `file` containing the data
/// and a `state` containing mapping information.
pub fn snapshot_file(
    file: File,
    regions: impl Iterator<Item = (GuestAddress, usize)>,
    track_dirty_pages: bool,
    huge_pages: HugePageConfig,
) -> Result<Vec<GuestRegionMmap>, MemoryError> {
    /* ... check the regions fit inside the file ... */
    create(
        regions.into_iter(),
        libc::MAP_PRIVATE,
        Some(file),
        track_dirty_pages,
        huge_pages.madvise_flags(),
    )
}
MAP_PRIVATE on a file means copy-on-write: every restored VM shares the same file pages until it writes to one, and at that moment the writer gets its own private copy of that page. The docs call the result "runtime on-demand loading of memory pages". Restore returns quickly because it has barely loaded anything yet.
That raises a question, because the memory has to come from somewhere eventually. When the guest touches a page that isn't in RAM yet, the CPU raises a page fault, a signal that tells the host "this memory isn't loaded", and the host loads that one page and lets the guest carry on. Here's what that looks like for two clones of thumbnail restored from one snapshot:
thumbnail finishes Init, the platform pauses the machine and saves its memory to a file. Three of its pages matter here: boto3's code, the S3 client, and the ID prefix 1a8fa67b that Init generated.5.3Where the restore time goes
Look back at frame 4. Every page the guest touches for the first time faults, and the host reads it from the snapshot file one page at a time.
Ustiugov et al. measured this in Benchmarking, Analysis, and Optimization of Serverless Function Snapshots (ASPLOS 2021). A function started from a Firecracker snapshot ran 95% longer, on average, than the same function already in memory, and the time went to those faults. Functions touched the same pages on every invocation, so their REAP prototype recorded that working set once and prefetched it in bulk. That cut cold-start delay by 3.7× on average.
Firecracker's own answer to the same problem is a userfaultfd backend. userfaultfd is a Linux feature that lets a separate process you supply answer the guest's page faults, and that process can fetch pages from wherever and in whatever order you like.
Faults are what a snapshot costs in time. The last frame of the scene showed what it can cost in correctness, and that is the trap SnapStart walks into.
5.4SnapStart, and state that must stay unique
SnapStart (November 2022, Java first; Python 3.12+ and .NET 8+ now) is Lambda's use of this idea. It runs Init once when you publish a version, takes a Firecracker snapshot of memory and disk, and restores new environments from it. AWS's launch example went from an Init of over 6 seconds to a start under 200 ms.
Restoring one snapshot into many environments means every one of them starts with the same memory. Anything your Init made that was supposed to be unique is now shared. Firecracker's docs are blunt about it: without a mechanism that keeps unique things unique, they "consider resuming execution from the same state more than once insecure."
Here's the problem on one Linux box, using fork() as a stand-in for a snapshot restore. The parent does the "Init": it creates a random generator and an ID prefix, just like thumbnail's. Three children then "invoke". Each prints four values: a number from the private generator the parent made, the ID prefix, a number from Python's global random generator, and a number from random.SystemRandom, which asks the kernel for fresh randomness every time.
import os, random, uuid

# "Init": runs once, before the snapshot (here, before fork)
rng = random.Random()                      # a private generator, seeded now
request_id_prefix = uuid.uuid4().hex[:8]

for child in range(3):
    if os.fork() == 0:                     # "restore" a clone
        print(f"clone {child}: Random()={rng.random():.6f} "
              f"prefix={request_id_prefix} "
              f"global random={random.random():.6f} "
              f"SystemRandom={random.SystemRandom().random():.6f}", flush=True)
        os._exit(0)
os.wait()clone 0: Random()=0.695238 prefix=1a8fa67b global random=0.785913 SystemRandom=0.897001
clone 1: Random()=0.695238 prefix=1a8fa67b global random=0.406180 SystemRandom=0.599397
clone 2: Random()=0.695238 prefix=1a8fa67b global random=0.310840 SystemRandom=0.585724Both the private generator and the ID prefix are identical in every clone. The
global random differs, and so does SystemRandom, which reads the kernel's
entropy each time.
The private generator and the prefix were made before the fork, so every clone carries the same copy, exactly as both clones in the scene held 1a8fa67b. The global generator and SystemRandom differ. SystemRandom differs because it asks the kernel every time. The global generator comes out different because CPython reseeds it in every forked child:
## ------------------ fork support  ---------------------

if hasattr(_os, "fork"):
    _os.register_at_fork(after_in_child=_inst.seed)
A VM snapshot restore has no such hook. No fork() happens inside the guest, so even that global generator would come back identical in every clone. What Lambda does provide, per its uniqueness docs, is a reseed of the kernel's /dev/random and /dev/urandom (the files programs read to get kernel randomness) on restore. Code that asks the kernel for randomness every time stays safe. Code that made its random state during Init and kept it in the program's own memory, like rng and the prefix above, does not.
A function whose Init has been snapshotted starts fast, but a burst of traffic needs many environments at once, and each environment serves one request at a time. How many does a burst need, and what are the other ways to avoid cold starts?
06Concurrency and the cold-start levers
So far we've followed one request. A real service gets bursts, and every photo that arrives while all existing environments are busy needs a new one, which means a cold start. So we need to know how many environments a given amount of traffic keeps busy.
6.1Concurrency is the unit you're sold
Lambda calls the number of environments busy at the same moment your function's concurrency. Concurrency is what your account's limits are written in, and since each environment serves one request at a time, it's also how many cold starts a burst can cause. Lambda's concurrency docs give the way to estimate it:
concurrency = average requests per second × average duration in secondsThat's Little's law: the average number of things in a system equals the rate at which they arrive times how long each stays. For thumbnail, suppose photos arrive at 100 a second and each takes 500 ms to process:
| Requests per second | arrival rate | 100 |
| Average duration | 500 ms ÷ 1,000 | 0.5 s |
| Environments busy at once | 100 × 0.5 | 50 |
| environments needed on average | 50 | |
That's an average, and averages hide the queueing, as chapter 16 shows. Lambda throttles requests that go over a limit, meaning it refuses them instead of running them. Each account has a concurrency quota, a cap on how many environments all its functions together may have busy at once in one Region (one of AWS's geographic areas). You can also reserve part of the quota for one function, so that the others can't use it up. Here are the limits that matter, from the same page:
| Limit | Default | What it means |
|---|---|---|
| Account concurrency, per Region | 1,000 | Shared by every function without a reservation |
| Scaling rate, per function | 1,000 new environments every 10 seconds | How fast a burst can be absorbed |
| Requests per second | 10 × your concurrency quota | Bites for very short functions |
| Reservable concurrency | Quota minus 100 | 100 always stays unreserved |
A function averages 20 ms, and at peak it gets 30,000 requests per second. The account has the default quota of 1,000. What happens?
Fifty environments in the first estimate means fifty cold starts the first time a burst arrives. So what can you do about cold starts?
6.2The levers, and what each one costs
Each part of the cold start has a lever, and each lever has a price.
| Lever | What it removes | What it costs you |
|---|---|---|
| Import less, lazily | Static init time: import only the clients you use, create rarely used ones on first use | Code discipline; the first request down a lazy path pays instead |
| More memory | CPU-bound init time: Lambda allocates CPU in proportion to memory, one virtual CPU at 1,769 MB (docs) | Higher price per millisecond |
| Provisioned concurrency (section 6.3) | The whole cold start, for up to N concurrent requests, by initialising N environments in advance | You pay for the environments while they sit idle |
| SnapStart | Runtime start and static init, replaced by a snapshot restore | Uniqueness bugs (section 5.4); can't be combined with provisioned concurrency |
| A smaller image or package | Fetch time, for cold chunks | Mostly already hidden by lazy loading; helps less than it used to |
| A keep-warm ping | Nothing reliable | It keeps one environment warm, not the N a burst needs |
6.3Provisioned concurrency
Provisioned concurrency runs Init ahead of time for a fixed number of environments and keeps them initialised. From the concurrency docs:
- It takes "a minute or two" to come online, and none of the environments are usable until the whole allocation is ready.
- Past N concurrent requests, traffic spills into ordinary on-demand environments, which cold-start as usual.
- Lambda still recycles provisioned environments in the background, so you can still see an occasional cold start after a reset.
- Init for provisioned (and SnapStart) functions may run for up to 15 minutes, not 10 seconds.
?Why does provisioned concurrency sometimes still log a slow first request?
Because Init finished long before the request arrived, and some work is lazy. The docs warn of "variable latency on the first invocation on an initialized execution environment". JIT compilation (the JVM compiling hot code as it runs), connection pools that open on first use and lazily loaded classes all land on that first request. Warm them up in your static init if they matter.
6.4Init is billed now
Until August 2025, Init time wasn't billed for functions uploaded as zip files and run on the runtimes AWS provides (its managed runtimes). From August 1, 2025, it is, the same as it already was for container images, custom runtimes (ones you supply yourself) and provisioned concurrency (AWS blog).
AWS expects the effect to be small, since Init runs for a small fraction of invocations; the docs say cold starts "typically occur in under 1% of invocations". But a slow Init is now a cost as well as a latency, and so is a crash loop that keeps re-running it.
With a function, Lambda decided where each environment ran, when to start it and when to throw it away, and you never saw those decisions. One rung down you make some of them yourself, and the machine that makes the rest is a scheduler.
07How a pod gets placed
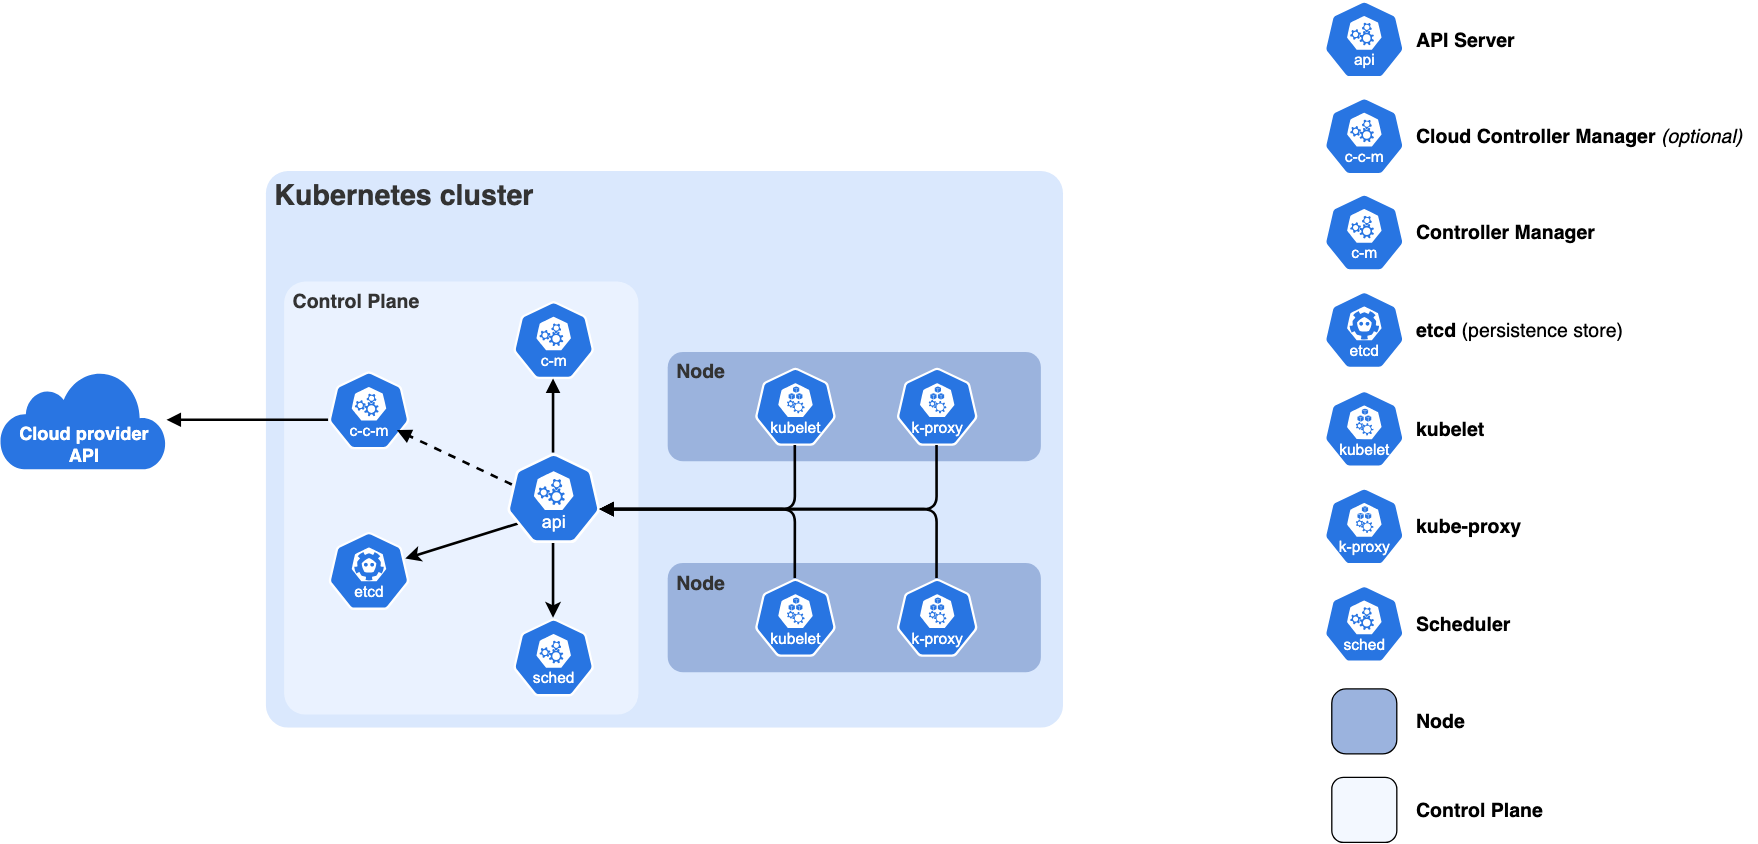
Suppose you run thumbnail yourself, as a container on a cluster, instead of as a function. Kubernetes is the system most teams use for that. It manages a cluster, a group of machines called nodes, and the unit it places on a node is a pod: one or more containers that run together on the same node. You write down what a pod needs, and a program called the scheduler (kube-scheduler) decides which node runs it. On this rung you can see your process, but you still don't pick its machine. The scheduler picks it, and it decides from numbers you wrote down in advance, without looking at how busy each node is.
7.1Requests, limits and QoS
Each container can declare a request and a limit for CPU and memory. The request is what the container says it needs, and the limit is the most it may use. They do different jobs, per the resource management docs, and the table below uses three more terms. The kubelet is the agent on each node that starts the pods assigned to it and sets up their cgroups. The CFS quota is how Linux's CPU scheduler (CFS, the Completely Fair Scheduler) caps a cgroup at so many milliseconds of CPU in every 100 ms period; chapter 11 measures it. And a container that is OOM-killed has been ended by the kernel's out-of-memory killer for using more memory than it was allowed.
| Request | Limit | |
|---|---|---|
| Used by | The scheduler, to pick a node | The kernel, at run time, via the kubelet's cgroup settings |
| CPU | A share of CPU under contention | A CFS quota: the container is throttled when it uses its share of each 100 ms period |
| Memory | Space reserved on the node | A hard ceiling: exceed it and the container is OOM-killed |
| If unset | Copied from the limit, if there is one | None |
?Why can a pod stay Pending on a cluster that's mostly idle?
Because the scheduler never looks at usage. A node is full when the sum of its pods' requests reaches its allocatable capacity (what's left of the machine after the system reserves its own share), however little CPU they burn. A team that requests 4 CPUs "to be safe" and uses 0.3 has reserved the rest of that node from everyone else, which seems harmless until the cluster fills up. A pod that hasn't been given a node is Pending.
Requests and limits together also set a pod's QoS class (quality of service). Here's the rule, per resource:
// resourceQOS determines the QOS "shape" of the given resource in the requirements:
// - BestEffort: Request and Limit are both zero
// - Burstable: Request != Limit
// - Guaranteed: Request and Limit are equal and non-zero
func resourceQOS(resources *v1.ResourceRequirements, res v1.ResourceName) v1.PodQOSClass {
	req := resources.Requests[res]
	lim := resources.Limits[res]

	if !req.Equal(lim) {
		return v1.PodQOSBurstable
	} else if req.IsZero() {
		return v1.PodQOSBestEffort
	} else {
		return v1.PodQOSGuaranteed
	}
}
A pod is Guaranteed only if every container has equal, non-zero requests and limits for both CPU and memory. Any mismatch makes it Burstable. The class decides who dies first when the node runs out of memory, through the oom_score_adj the kubelet writes for each container (pkg/kubelet/qos/policy.go). That's a number the kernel's OOM killer reads for each process: the higher it is, the sooner the process is picked.
| QoS class | oom_score_adj | Meaning |
|---|---|---|
| Guaranteed | −997 | Almost never picked by the kernel's OOM killer |
| Burstable | 1000 − 1000 × request ÷ node memory, clamped to 3–999 | The bigger your request, the safer you are |
| BestEffort | 1000 | Killed first |
Requests are numbers the scheduler reads. Next we'll see what it does with them when a pod arrives.
7.2The scheduling cycle
kube-scheduler watches for pods with no node assigned and gives each one a node. It does so as a pipeline of stages, each a fixed extension point where small pieces of logic called plugins run. Roughly: the pod waits in a queue, Filter plugins throw out every node that can't run it, Score plugins rate the nodes that are left, the scheduler reserves room on the winner and binds the pod to it (writes the choice to the cluster's central record, the API server), and the kubelet on that node starts the containers. The scheduling framework docs name every hook. Here's one pod's trip through it:
?Why is the scheduling cycle serial when binding isn't?
The docs put it in one line: "Scheduling cycles are run serially, while binding cycles may run concurrently." Each decision has to see the reservations of the one before it, or two pods could be placed into the same free space. Binding involves API writes and maybe volume attachment, which are slow and don't change the decision, so they run off the critical path.
Every default plugin is enabled at every extension point it implements, with weights for the scoring ones:
// getDefaultPlugins returns the default set of plugins.
func getDefaultPlugins() *v1.Plugins {
	plugins := &v1.Plugins{
		MultiPoint: v1.PluginSet{
			Enabled: []v1.Plugin{
				{Name: names.SchedulingGates},
				{Name: names.PrioritySort},
				{Name: names.NodeName},
				{Name: names.NodeUnschedulable},
				{Name: names.TaintToleration, Weight: ptr.To[int32](3)},
				{Name: names.NodeAffinity, Weight: ptr.To[int32](2)},
				{Name: names.NodePorts},
				{Name: names.NodeResourcesFit, Weight: ptr.To[int32](1)},
				{Name: names.VolumeRestrictions},
				{Name: names.NodeVolumeLimits},
				{Name: names.VolumeBinding},
				{Name: names.VolumeZone},
				{Name: names.PodTopologySpread, Weight: ptr.To[int32](2)},
				{Name: names.InterPodAffinity, Weight: ptr.To[int32](2)},
				{Name: names.DefaultPreemption},
				{Name: names.NodeResourcesBalancedAllocation, Weight: ptr.To[int32](1)},
				{Name: names.ImageLocality, Weight: ptr.To[int32](1)},
				{Name: names.DefaultBinder},
			},
		},
	}
	/* ... */
When a pod can't be placed, the Filter plugins' reasons are counted and put in the pod's FailedScheduling event, in the format 0/N nodes are available: <reasons>. That message is the first thing to read.
Filtering every node for every pod gets expensive when a cluster has thousands of them, and the scheduler has a shortcut for that.
7.3Not every node gets looked at
On a large cluster, running every Filter against every node for every pod is too slow. So the scheduler stops once it has found "enough" feasible nodes:
func (sched *Scheduler) numFeasibleNodesToFind(percentageOfNodesToScore *int32, numAllNodes int32) (numNodes int32) {
	if numAllNodes < minFeasibleNodesToFind {       // 100
		return numAllNodes
	}
	/* ... use the profile's percentageOfNodesToScore if set ... */
	if percentage == 0 {
		percentage = int32(50) - numAllNodes/125
		if percentage < minFeasibleNodesPercentageToFind {   // 5
			percentage = minFeasibleNodesPercentageToFind
		}
	}

	numNodes = numAllNodes * percentage / 100
	if numNodes < minFeasibleNodesToFind {
		return minFeasibleNodesToFind
	}
	return numNodes
}
Under 100 nodes, it checks all of them. At 1,000 nodes it stops after 420 feasible ones (42%); at 5,000, after 500 (10%). It walks nodes round-robin across zones and resumes where the last pod left off, per the performance tuning docs, so the sample moves around the cluster.
?Doesn't that mean the pod might not get the best node?
Yes, on purpose. The best of 500 feasible nodes, taken from a sample that moves around the cluster, is usually close to the best of all 5,000, and it takes about a tenth of the work to find. Borg, Google's cluster manager and Kubernetes' ancestor, made the same trade and called it relaxed randomization (section 8).
Among the nodes it did look at, the scheduler still has to pick one.
7.4Spread or pack
For resources, the main scoring plugin is NodeResourcesFit, and its default strategy is LeastAllocated: prefer the node with the most room left.
// The unused capacity is calculated on a scale of 0-MaxNodeScore
// 0 being the lowest priority and `MaxNodeScore` being the highest.
// The more unused resources the higher the score is.
func leastRequestedScore(requested, capacity int64) int64 {
	if capacity == 0 {
		return 0
	}
	if requested > capacity {
		return 0
	}

	return ((capacity - requested) * fwk.MaxNodeScore) / capacity
}
An empty 4-CPU node scores 100, and one with 1 CPU already requested scores (4 − 1) × 100 ÷ 4 = 75. Let's run it on a small cluster: three nodes with 4 CPUs each, and thumbnail running as six pods that each request 1 CPU.
thumbnail runs as six pods, each requesting 1 CPU, and the cluster has three empty nodes. The scheduler takes the pods one at a time: it filters the nodes (all three have room) and scores them.Spreading leaves headroom on every node for a load spike and limits the blast radius of one node dying. It has a cost, though:
Three nodes with 4 allocatable CPUs each hold the six 1-CPU pods placed by LeastAllocated, two per node. Now a pod requesting 3 CPUs arrives. Where does it go?
Borg's paper describes the same tension. Its original scorer spread load ("we sometimes call this 'worst fit'") and fragmented machines for large tasks. Pure best fit packed tightly but "penalizes any mis-estimations in resource requirements". The hybrid it settled on tries to minimise stranded resources, capacity left unusable because another resource on the machine is full, and gave "about 3–5% better packing efficiency" than best fit.
Resources decide whether a pod can fit. Operators usually also want to say where a pod must not go, and where it should.
7.5Taints, tolerations and affinity
Resource fit decides whether a pod can go on a node. A handful of other mechanisms decide whether it should. A taint is a mark on a node that repels pods. A toleration is a pod's permission to ignore a taint. Affinity is a rule on a pod that pulls it towards nodes, or towards other pods, with certain labels (key=value tags attached to nodes and pods).
| Mechanism | Set on | Hard or soft | Typical use |
|---|---|---|---|
Taint NoSchedule / PreferNoSchedule | The node | Hard / soft | Keep general pods off GPU or dedicated nodes |
Taint NoExecute | The node | Hard, and evicts running pods | Node problems: not-ready, unreachable |
| Toleration | The pod | — | Let a pod onto a tainted node; it doesn't attract it there |
| Node affinity | The pod | required… or preferred… (weight 1–100) | Pin to a zone, an instance type, an architecture |
| Pod (anti-)affinity | The pod | Either | Co-locate with a cache; keep replicas apart |
| Topology spread | The pod | maxSkew (how uneven the counts may get), hard or soft | Even replicas across zones |
A few details from the taints and affinity docs catch people:
- A toleration isn't an attraction. It permits a pod onto a tainted node. To keep a pod on dedicated nodes, you need a taint and node affinity.
IgnoredDuringExecutionmeans what it says. Change a node's labels after scheduling and its pods keep running.- Every pod tolerates dead nodes for five minutes. The
DefaultTolerationSecondsadmission controller (a plugin in the API server that edits pods as they're created) adds 300-second tolerations fornot-readyandunreachable, so pods on a lost node aren't evicted for five minutes. - Inter-pod affinity is expensive. The docs say it "require[s] substantial amounts of processing" and "we do not recommend using them in clusters larger than several hundred nodes." Topology spread constraints cover most of the same needs.
When even these rules can't find a node, the scheduler has one more move.
7.6Preemption
When Filter finds no node, the default PostFilter plugin looks for lower-priority pods it could evict. Priority comes from a PriorityClass; user classes go up to 1,000,000,000, and the two system classes sit above that, per the priority docs. A PodDisruptionBudget (PDB) is a limit an application sets on how many of its pods may be taken down at once, and preemption tries to respect it.
?Why doesn't preemption just bind the pod straight away?
Because the space isn't free until the victims have exited, which can take their full grace period. Recording a nomination and retrying lets the scheduler keep working, and lets the pod take a better spot if one opens up.
PodDisruptionBudgets are respected only on a best-effort basis: if no other option exists, preemption will violate one. A class with preemptionPolicy: Never gets its place in the queue by priority but never evicts anything.
The scheduler has now chosen a node and written its name down. Whether the pod runs there is up to someone else.
7.7The kubelet has the last word
Binding only writes a node name. The kubelet on that node then runs its own admission check against its own view of the node, and it can refuse. The reasons are fixed strings in pkg/kubelet/lifecycle/predicate.go: OutOfcpu, OutOfmemory, OutOfephemeral-storage, OutOfpods. A pod rejected here goes to Failed, and its controller (the Kubernetes component that keeps the right number of copies running) creates a replacement.
After admission the kubelet does the pod's cold start. It creates the pod's sandbox and its network through two standard interfaces (CRI for the container runtime, CNI for networking), pulls images, runs init containers (containers that must finish before the app starts), starts the app containers, and waits for readiness probes (health checks that must pass before traffic arrives). Image pulls are serialised by default: serializeImagePulls defaults to true unless you set maxParallelImagePulls to 2 or more (defaults.go). One large image can hold up every other pod starting on the node.
Later, under memory or disk pressure, the kubelet evicts pods itself, with no PDBs and no grace period for hard thresholds (memory.available under 100 Mi by default). It goes first for pods using more than they requested, then by priority, then by how far over their request they are, per the node-pressure eviction docs.
A scheduler with filters, scores, sampling and a second check at the node can look over-engineered. Each part has a history.
08Borg, Omega, and why the scheduler looks like this
Kubernetes' scheduler descends from two Google systems with public papers, a lineage its authors describe in Borg, Omega, and Kubernetes (ACM Queue, 2016). The papers explain design choices that look arbitrary on their own.
8.1Borg: feasibility, scoring, and shortcuts
Large-scale cluster management at Google with Borg (Verma et al., EuroSys 2015) describes a scheduler in two parts, "feasibility checking, to find machines on which the task could run, and scoring, which picks one of the feasible machines". Kubernetes' Filter and Score are the same split.
The paper's median cell (Borg's name for a cluster) was about 10,000 machines, and three shortcuts made that tractable:
| Borg technique | What it does | Kubernetes' version |
|---|---|---|
| Score caching | Keep a machine's score until the machine or task changes | The scheduler's cache and per-cycle state |
| Equivalence classes | Score one task per group of identical tasks | An equivalence cache, removed in 2018; now OpportunisticBatching (KEP-5598, a Kubernetes Enhancement Proposal; beta and on by default since 1.35) reuses one pod's ranked nodes for the next pod with the same signature |
| Relaxed randomization | Examine machines in random order until "enough" are feasible | percentageOfNodesToScore (section 7.3) |
Without them, scheduling a cell's whole workload from scratch "did not finish after more than 3 days"; with them it took "a few hundred seconds".
?What did Borg find was the slow part of starting a task?
The scheduler wasn't it. Median task startup was "about 25 s", and package installation took "about 80% of the total". So Borg's scorer preferred machines that already had the task's packages. That's the ImageLocality score plugin in Kubernetes, and it's the same lesson as section 4: fetching code and running init dominate.
Borg also over-committed on purpose. It reserved what a task was predicted to use, not what it asked for, and "about 20% of the workload" ran in the reclaimed gap. Kubernetes' requests and limits are a simpler form of that idea: the request is what you're promised, and the gap up to the limit is borrowed.
8.2Omega: shared state and optimistic placement
Omega (Schwarzkopf et al., EuroSys 2013) compared three architectures: a monolithic scheduler, a two-level design like Mesos (another cluster manager) where a central allocator offers resources to framework schedulers, and its own shared state, where several schedulers see the whole cluster and commit placements with "lock-free optimistic concurrency control". A conflicting commit is retried.
Kubernetes is mostly monolithic, with an Omega flavour. One scheduler makes decisions serially, but the cluster state lives in the API server and every write is a compare-and-swap on resourceVersion (an update that succeeds only if nobody has changed the object since you read it). You can run a second scheduler beside the default one, and both commit through the API server. But nothing in the API server checks a node's capacity when a pod is bound, so two schedulers can place pods into the same free space. The kubelet's admission check (section 7.7) catches the loser.
Now that every rung has been taken apart, the remaining question is how to see these costs and decisions on a system you run.
09Operating it
9.1What each start costs
Here are the numbers from this chapter side by side. They come from different systems, so they show the scale of each cost and aren't a benchmark of one against another.
9.2Where to look
Each question the chapter raised has a tool that answers it on a running system.
# Kubernetes: why is this pod Pending? (sections 7.1 and 7.2)
kubectl describe pod thumbnail-7d9f -n prod | sed -n '/Events/,$p'   # "0/N nodes are available: ..."
kubectl get events -A --field-selector reason=FailedScheduling
kubectl describe node ip-10-0-3-7 | sed -n '/Allocated resources/,/Events/p'  # requests vs allocatable

# Is a container throttled? (section 7.1)
cat /sys/fs/cgroup/cpu.stat          # from inside it: nr_periods, nr_throttled, throttled_usec

# Lambda: which invocations were cold, and how long was Init? (sections 3 and 4)
#   REPORT lines carry "Init Duration: … ms" only on cold starts.
#   INIT_REPORT lines appear on Init timeouts and failures, and always with SnapStart or provisioned concurrency.
aws logs filter-log-events --log-group-name /aws/lambda/my-fn --filter-pattern '"Init Duration"'
In Python, python -X importtime -c 'import yourmodule' prints the time each import took, which is usually where a function's static init goes (section 4.2).
9.3Rules that hold up
- Keep static init small and lazy. Import only the clients you use, and create rarely used ones on first use (section 4).
- Generate anything that must be unique inside the handler or with a CSPRNG that reads the kernel, never in static init, as soon as snapshots are involved (section 5.4).
- Size concurrency with rate × duration, then check the requests-per-second limit too, because very fast functions hit it first (section 6.1).
- Use provisioned concurrency for a latency floor. A keep-warm ping keeps one environment alive and no more (section 6.2).
- Set requests from real usage, and make memory request equal to limit for anything important, so the pod is Guaranteed or at least well protected (section 7.1).
- Think twice before a tight CPU limit on a latency-sensitive service, and watch
nr_throttled(section 7.1). - Plan for the empty cache. If your cold path depends on a cache, decide what happens on the day it's empty (section 3.3).
9.4What you give up
| You get | You pay | When the bill arrives |
|---|---|---|
| A kernel of your own (VM, microVM) | Boot or restore time, and memory for a second kernel | Every scale-out, unless something is kept warm |
| Density on a shared kernel (containers) | A boundary that's the kernel's syscall surface | The next kernel escape CVE (a numbered public record of a security bug) |
| Scale to zero (functions) | Cold starts, and a platform that recycles your process | The first request after a quiet period, or a burst |
| Snapshots instead of init | Clones that share every byte of state | The day two requests get the same ID |
| A scheduler that places for you | Decisions made from requests, not usage | The first time a Pending pod meets an idle dashboard |
| Spreading by default | Fragmented free space | When a large pod arrives |
9.5Symptom, cause, fix
Each row starts from something you'd see on a running system and names the mechanism from this chapter behind it. One new term appears: a descheduler evicts running pods so that the scheduler can place them again, this time packed more tightly.
| Symptom | Likely cause | Fix |
|---|---|---|
Pod Pending, cluster CPU graphs show plenty free | Requests, not usage, fill nodes | Right-size requests from real usage; look at Allocated resources on nodes |
Pod Pending with enough total free, but no single node fits | Fragmentation from spreading | MostAllocated scoring, bigger nodes, or a descheduler; let the autoscaler add a node |
0/N nodes are available: N node(s) had untolerated taint | Missing toleration, or a node still tainted not-ready | Add the toleration, or fix the node |
| Latency spikes, CPU usage well under the limit | CFS throttling within 100 ms periods | Raise or remove the CPU limit; check nr_throttled; kernel 5.4 or later |
| BestEffort pods die first under pressure | oom_score_adj 1000 and eviction order | Set requests; memory request = limit for anything important |
| New pods on one node start slowly | Serialised image pulls behind one large image | Smaller images, pre-pulled images, maxParallelImagePulls |
| Lambda p99 bad after quiet periods, fine under steady load | Cold starts on scale-out and after recycling | Trim static init, then provisioned concurrency or SnapStart |
| Lambda throttles well under the concurrency quota | The 10× requests-per-second limit, or the scaling rate | Raise the quota; smooth the burst with a queue |
| Duplicate IDs or identical random values after enabling SnapStart | Uniqueness generated during Init | Generate in the handler, use a kernel CSPRNG, or an after-restore hook |
| A function "occasionally" doubles its duration after an error | Suppressed init after a crash reset | Fix the crash; watch for Init time inside the REPORT duration |
10Summary
- Each rung hides one more layer. VMs hide hardware, containers hide the OS install, functions hide the process and whether it's running at all.
- Serverless platforms keep the separate kernel. Lambda and Fargate give each tenant a Firecracker microVM; density comes from making VMs small, not from sharing a kernel.
- A function's life is Init, Invoke and Shutdown, frozen between requests. A cold start is the wait for Init, and a warm start thaws an environment whose globals are still set.
- Lambda loads code lazily and from caches. Images are cut into 512 KiB chunks, deduplicated by convergent encryption, and almost every read is served by the worker or AZ cache; only about 0.06% go to S3.
- Booting isn't the slow part; initialising is. A microVM reaches init in under 125 ms. Runtime start and your static code usually cost more, and a process forked after its imports starts about 300 times faster.
- Snapshots replace init with page faults. Memory is mapped copy-on-write and loaded as touched; prefetching the working set is what makes restores fast.
- Clones share everything, including secrets. With SnapStart, anything unique created during Init is duplicated in every environment.
- Concurrency is Little's law. Requests per second × duration, with a separate 10× requests-per-second limit that fast functions hit first.
- The scheduler reads requests, never usage. Pods go Pending on idle clusters, and requests versus limits also set the QoS class that decides who gets OOM-killed.
- Filter, then score, on a sample. Large clusters score only a slice of nodes, and the default scorer spreads, which fragments free space.
- Placement isn't finished at bind. The kubelet can still reject the pod, pull images one at a time, and later evict it under pressure.
11Build this
A cold-start budget for one service.
- Pick a real function or service and break its start into the six pieces of section 4.1. Measure your part with
python -X importtime,-Xlog:startuptimeor--cpu-prof, whichever fits your runtime. - Build a "zygote": a parent that does all static init, then forks a child per request. Compare its time-to-first-byte with a fresh start, as in section 4.2.
- Add the uniqueness test from section 5.4 to your code base: fork after init and assert that every ID, seed and token differs between the children.
- On a kind or minikube cluster (a small Kubernetes cluster that runs on one machine) with three small nodes, reproduce the Predict in section 7.4, then switch
NodeResourcesFittoMostAllocatedin a scheduler profile and watch the large pod fit.
12Interview questions
beginnerWhat's the difference between a request and a limit in Kubernetes?›
The scheduler uses requests to place pods: a node is full when the sum of requests reaches its allocatable capacity. Limits are enforced at run time: a CPU limit becomes a CFS quota and throttles, and a memory limit is a ceiling past which the container is OOM-killed. If you set only a limit, the request defaults to it. Together they set the QoS class.
beginnerWhat is a Lambda cold start?›
A request that arrives when no initialised execution environment is free. Lambda has to place a new microVM, load the code, start the runtime and run the function's static initialisation before the handler runs. The static init is usually the biggest part, and the part you control. Warm requests reuse a frozen environment and skip all of it.
intermediateA pod is Pending, but the cluster's CPU usage is 30%. Why?›
Probably requests. The scheduler compares requests, not usage, against allocatable capacity, so
nodes can be "full" of reservations while idle. Or the free capacity is
fragmented: plenty in total, but no single node has enough, which the default
spreading scorer makes likely. Read the FailedScheduling event, then compare
Allocated resources with actual usage on the nodes.
intermediateProvisioned concurrency or SnapStart: how do you choose?›
Provisioned concurrency keeps N environments fully initialised, so the first N concurrent requests never see a cold start, at a cost for idle time. SnapStart restores new environments from a post-init snapshot, which cuts the cold start instead of removing it, at no extra charge, but it duplicates any state that Init made unique. You can't use both on one version. Pick provisioned concurrency for a predictable floor, SnapStart for a heavy init with bursty traffic.
intermediateHow does Lambda start a 10 GiB container image quickly?›
It doesn't download it. The image is flattened and split into 512 KiB chunks, and the microVM sees a block device whose reads are served lazily, chunk by chunk, from a worker-local cache, then an AZ-level cache, then S3. Containers read only a small fraction of their data at startup, and convergent encryption lets identical chunks across customers be stored and cached once.
deepWhat goes wrong when you restore many VMs from one snapshot?›
Every clone starts with identical memory, so every generator state, cached
random bytes, UUID and nonce created before the snapshot is shared. Unlike
fork(), a VM restore runs no at-fork hooks in the guest's processes. Lambda
reseeds the kernel's /dev/random and /dev/urandom on restore, so code
reading the kernel every time is safe; user-space RNGs and anything cached at
init need regenerating in the handler or an after-restore hook.
deepWhy does kube-scheduler not score every node in a 5,000-node cluster?›
Filtering and scoring every node for every pod doesn't scale. By default it
stops after finding a percentage of feasible nodes, 50 − nodes/125, floored at
5% and at 100 nodes: 500 nodes at 5,000. It walks nodes round-robin across
zones and resumes where it left off. The best of a large sample is usually close
to the global best. Borg did the same and called it relaxed randomization.
deepWhy can a pod that the scheduler bound still fail to start on the node?›
Binding only records a node name. The kubelet runs its own admission against
its own view of the node's resources and can reject with OutOfcpu,
OutOfmemory or OutOfpods, for example when a second scheduler or a static
pod (one the kubelet starts itself from a file, without going through the
scheduler) used the same space. The shared state is optimistic, in Omega's
sense, and the kubelet is the final check.
13Go deeper
A container requests 500m CPU and 1 Gi memory, and has limits of 1 CPU and 1 Gi. What's its QoS class?›
Burstable. Memory's request equals its limit, but CPU's doesn't, and any mismatch in any resource makes the pod Burstable.
Your Lambda's static init takes 12 seconds. What happens on a cold start?›
Init is cut off at 10 seconds, then retried at the first invocation under the function's own timeout. Provisioned concurrency and SnapStart functions can run Init for much longer.
How many nodes does the default scheduler look for in a 1,000-node cluster?›
420: the percentage is 50 − 1000/125 = 42%.
What does a Firecracker snapshot restore read from the memory file up front?›
Almost nothing. It maps the file MAP_PRIVATE, so pages are loaded on first touch and copied on first write.
Best paper. Lazy block loading, convergent encryption, tiered caches, erasure coding in the cache, and how a very good cache can turn its own outage into an overload of the origin. arXiv.
Why Lambda moved from containers in per-customer VMs to microVMs, and what the minimal device model buys. USENIX.
Where snapshot restore time goes (page faults) and how recording a working set fixes it. arXiv.
Feasibility and scoring, relaxed randomization, resource reclamation, and the 25-second task start. Google Research.
Monolithic, two-level and shared-state schedulers compared on Google traces. Google Research.
Azure Functions' production workload: 81% of applications invoked at most once a minute on average, and a histogram keep-alive policy that beats a fixed timeout. arXiv.
The scheduling cycle itself: schedulePod, findNodesThatFitPod,
prioritizeNodes. v1.37.0.
The primary source for section 3.1, including suppressed inits and the shutdown limits. AWS docs.
14Related chapters
The mechanism under the VM and microVM rungs: exits, nested paging, virtio, and Firecracker's numbers. Chapter 47.
Namespaces, cgroups and overlayfs, and a measured CPU limit. Chapter 11.
Little's law and why the average hides the cold-start tail. Chapter 16.
The kernel's scheduler, one level below kube-scheduler: CFS, quotas and run queues. Chapter 06.