In chapter 08 you added "eggs" to your note and pressed Save. The app called write(), then fsync(), and when fsync() returned the note was safe. The last thing the filesystem did on the way there was tell the drive: "store these bytes in block 7", the same block that held "buy milk" a moment earlier.
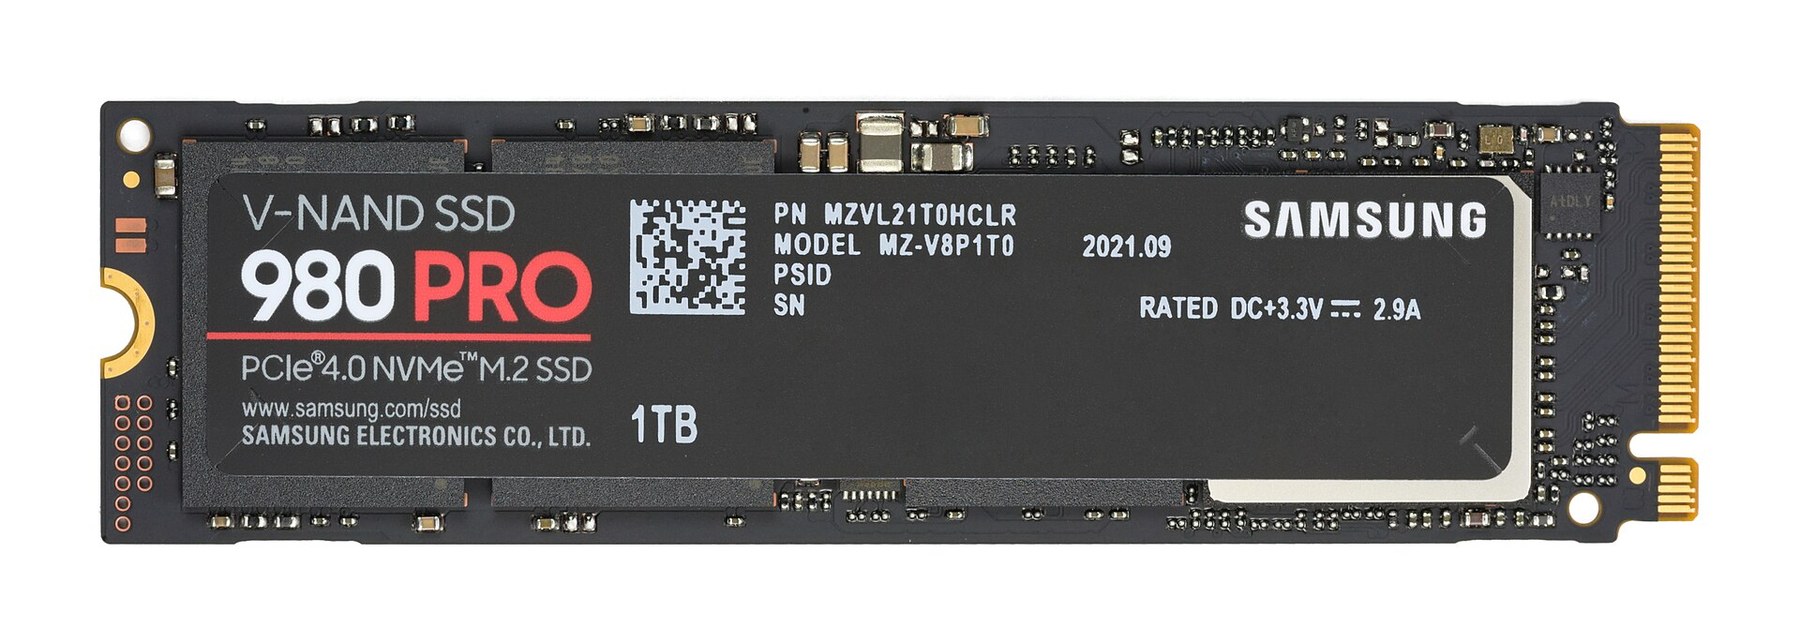
It's natural to picture the drive going to a place called block 7 and replacing the old bytes with the new ones, the way you'd rub out a word in a notebook and write over it. On a spinning hard drive that picture is close to the truth. On the SSD inside most computers today it can't be true at all, because flash chips cannot overwrite anything. The drive keeps up the appearance with a trick, and the trick decides how fast the drive is, how long it lasts, and whether "saved" can be trusted.
The part of the system that does this sits between the filesystem and the flash chips, and this chapter follows block 7 down into it. The question we'll keep asking is: when the filesystem says "overwrite block 7", what does the drive do with it, and what does that cost? We'll start by asking a real drive what it says it is, then work out why it can't be telling the whole story.
01What the drive says it is
1.1Asking the operating system
The quickest way to see what the filesystem sees is to ask for it. On macOS, diskutil info disk0 prints facts about the first physical drive, and grep -E keeps only the lines that match one of the four patterns we give it. On Linux, lsblk does a similar job, and the ROTA column it prints says whether the drive is a spinning disk (1) or flash (0).
diskutil info disk0 | grep -E "Media Name|Solid State|Device Block Size|Disk Size"
# Linux: lsblk -d -o NAME,ROTA,PHY-SEC,SIZE (ROTA 0 means flash) Device / Media Name: APPLE SSD AP0512Z
Disk Size: 500.3 GB (500277792768 Bytes) (exactly 977105064 512-Byte-Units)
Device Block Size: 4096 Bytes
Solid State: YesRead it line by line. The first line is the product name, and the last says the drive is solid state, meaning flash chips and no moving parts. The size is about 500 GB. The 512-byte units in brackets are the same size counted in the small blocks older drives used, which is why the number looks different. The line that matters most is the third: Device Block Size: 4096 Bytes. Divide 500,277,792,768 bytes by 4,096 and you get about 122 million blocks.
That's exactly the picture from chapter 08. The operating system sees the drive as a numbered row of 4,096-byte blocks, and it can ask for two things: read block n, or write block n. Software that offers this view of a storage device is called a block device, and its promise is short. Write block 7 and read it back later, and you get your bytes. Overwrite block 7 and the old contents are gone. Blocks stay where they are and keep what you wrote.
1.2What the answer leaves out
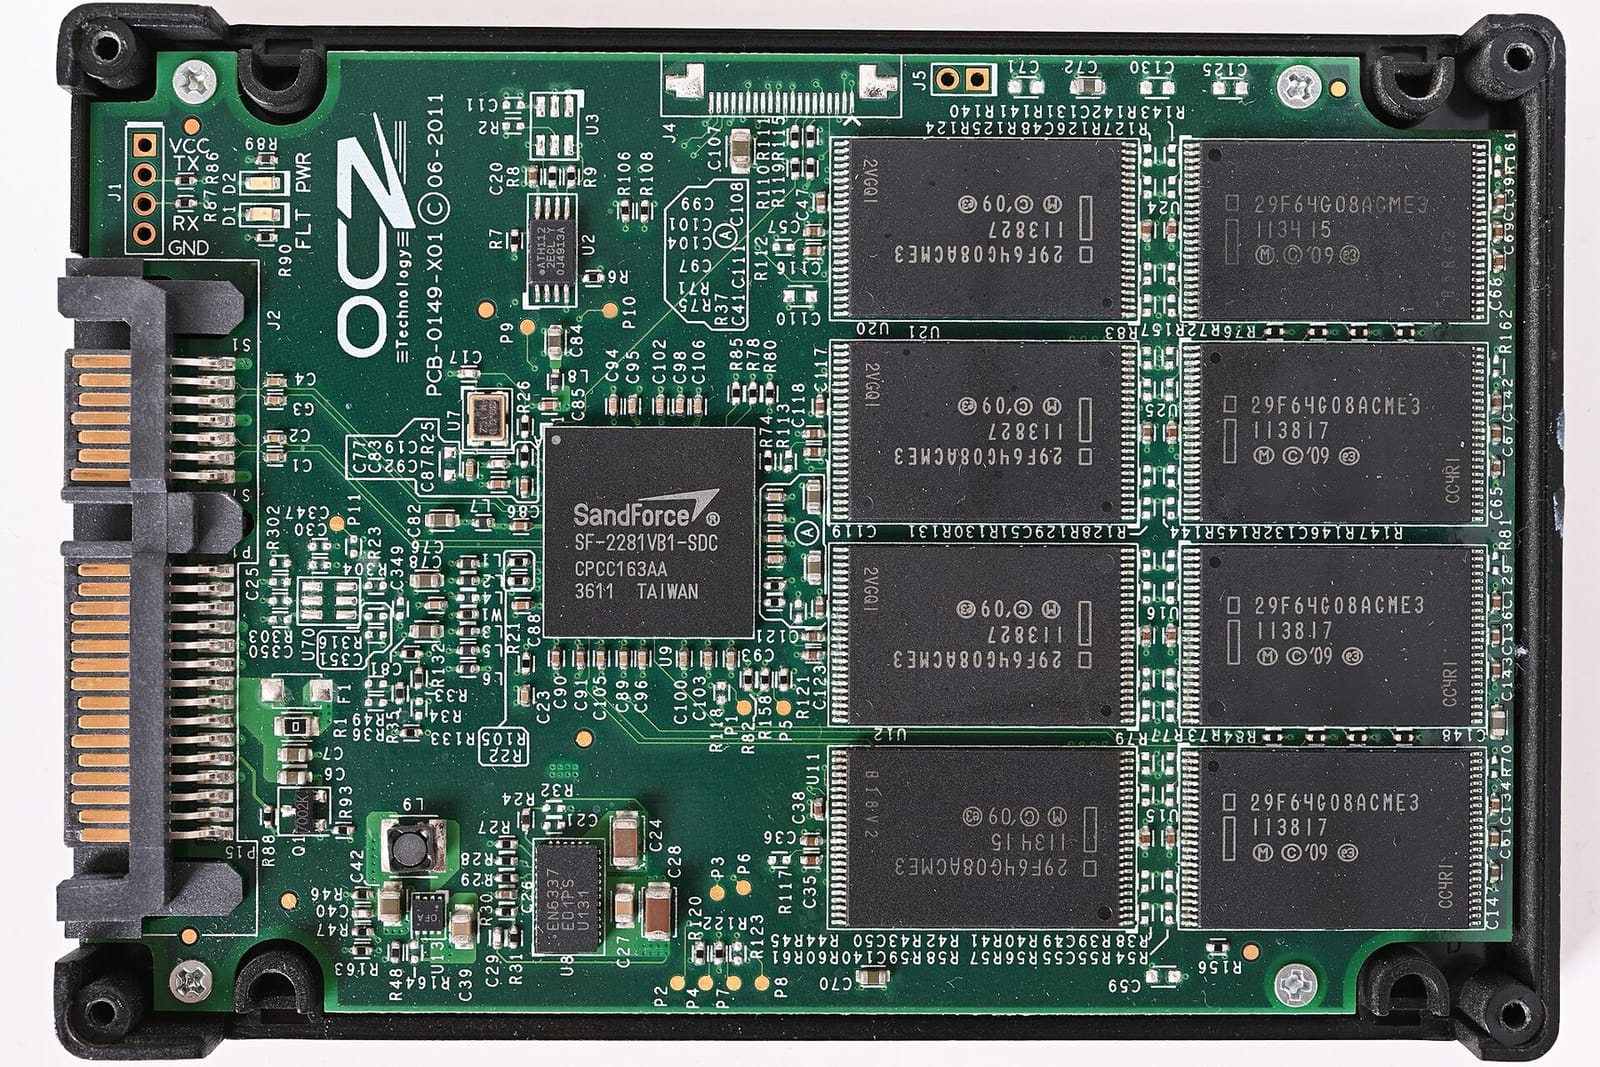
Everything that diskutil printed describes the promise. None of it says what's inside the drive: how the flash chips are organised, where block 7's bytes physically sit, what the drive's own processor is doing while nobody is asking it for anything.
That's deliberate. If every filesystem had to know the internals of every make of drive, nothing would work with anything else, so the drive hides its insides behind the same simple contract and the filesystem trusts it. The cost of the hiding is that those insides decide how fast the drive is and how long it lasts, and you can't see them from above.
The contract was written long before flash existed, for a different kind of drive, and its shape only makes sense once you've seen that drive.
02The drive the contract was written for
2.1Block 7 on a platter
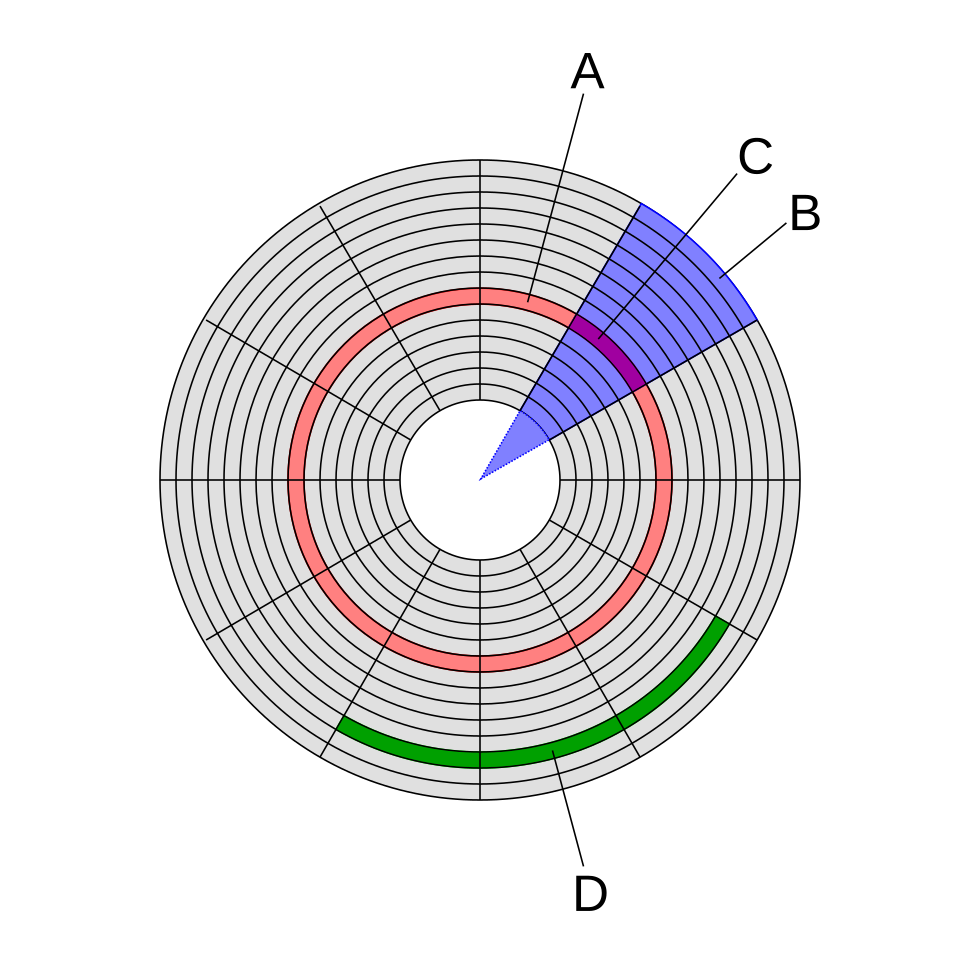
A hard disk stores data as magnetic patterns on one or more metal platters, which spin at a few thousand rotations a minute (7,200 is common). Above each platter an arm carries a read/write head that can sense or change the pattern directly beneath it. On this kind of drive, block 7 is a real spot on a real platter. To overwrite it, the arm swings the head over the right ring of the platter, the drive waits for the platter to spin until block 7 passes underneath, and the head writes the new pattern on top of the old one. The contract is literally true.
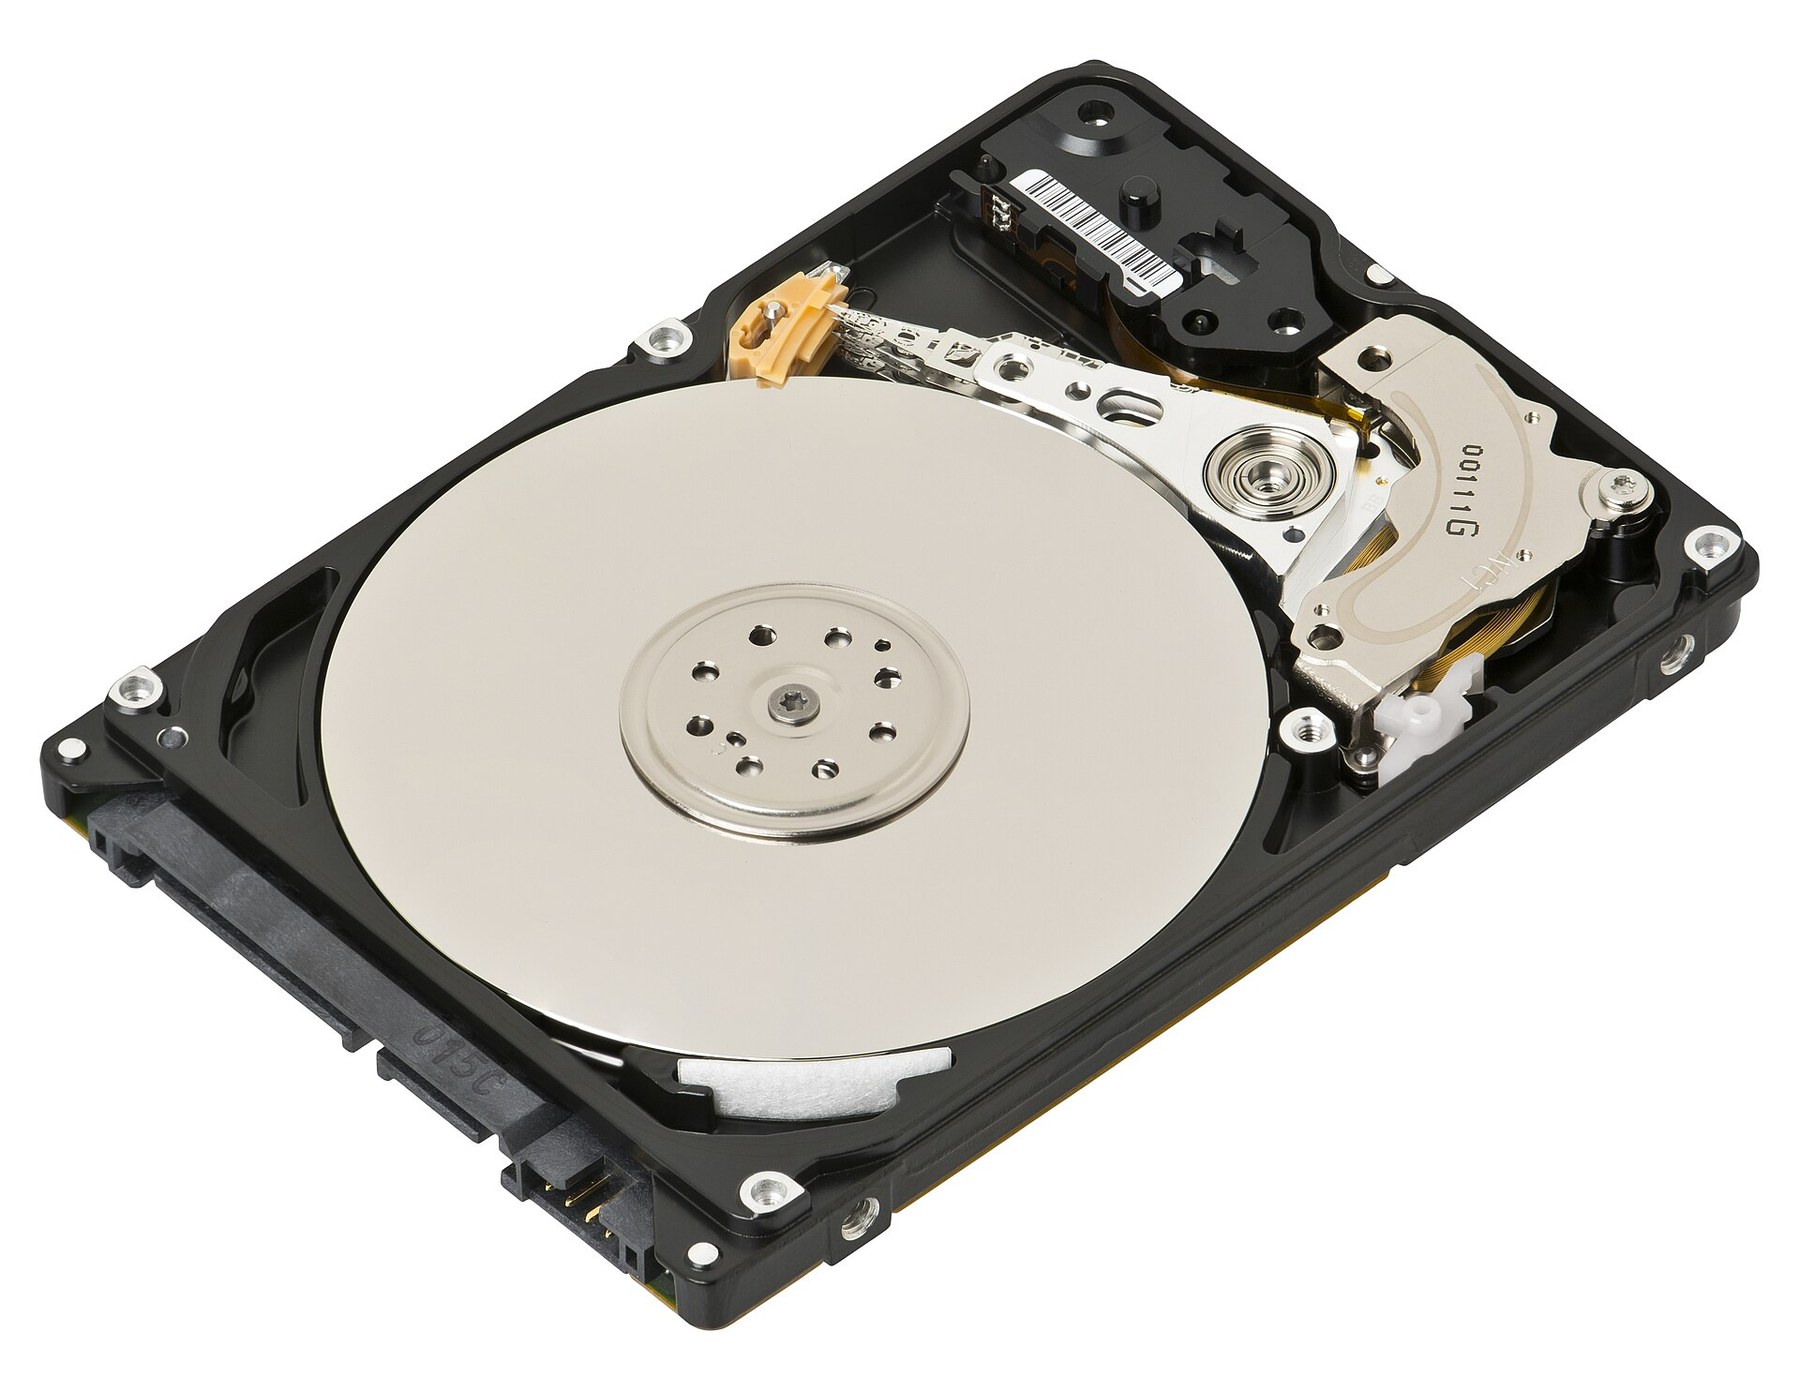
That also tells us where the time goes. Moving the arm, called a seek, and waiting for the platter to come round are both mechanical, and both are slow compared with reading bits once the head is in place.
2.2The advice that came from it
?Why did everyone learn to avoid random I/O?
Because of those two mechanical waits. Reading blocks 7, 8 and 9 in order is called sequential access, and it pays for one seek and then reads straight through as the platter turns. Reading blocks scattered across the disk is random access, and it pays for a seek and a wait on every single block. Each of those waits is measured in milliseconds, while reading a block that's already under the head takes microseconds. On a 7,200 rpm disk, scattered reads came out roughly a hundred times slower than reading the same blocks in order, and often worse.
A great deal of storage advice comes from that one ratio. Append-only logs, which only ever add to the end of a file, are one example. Kafka, a system that passes messages between programs, is built on exactly such logs. Databases built on LSM-trees, like RocksDB and Cassandra, are a third example. An LSM-tree holds small writes in memory and writes them to disk in large sorted batches, so the disk sees long sequential writes instead of scattered ones. The slogan behind all of it is "avoid random I/O".
That advice rests on a ratio of about a hundred, and the ratio came from a moving arm. Flash has no arm and no platter, so we should ask whether the ratio survives.
03Flash: cheap to read, strange to write
3.1Random reads on flash
Flash is memory that keeps its contents with the power off and has no moving parts. Nothing has to swing and nothing has to spin, so a read of block 7 shouldn't care where block 7 is.
Reading a 3 GB file 4 KB at a time, one read after another, with the page cache bypassed so every read reaches the drive. Compared with reading it in order, how much slower is reading it at random offsets on a laptop SSD?
So the penalty for reading at random fell from about a hundred to about 4.7 times. The belief that random I/O is ruinous is probably the most out-of-date idea in storage engineering. "Random I/O is catastrophic, so always design for sequential access" was correct advice for spinning disks, and on flash it has shrunk to a mild preference. Flash has no head to swing, so whatever gap remains has nothing to do with moving parts.
?Why are B-trees competitive with LSM-trees again?
A B-tree is the older database design. It keeps its data in sorted chunks on disk and updates each chunk where it sits, which means lots of random writes. LSM-trees won on spinning disks by turning those random writes into sequential ones, which was worth about 100×. On flash that conversion is worth about 4.7×, and an LSM-tree also rewrites its data again and again in the background to merge its sorted batches, which costs writes of its own.
So the trade is close now, and modern B-tree engines are competitive again. Hardware settled this design argument once and then reopened it when the hardware changed, which is worth remembering the next time a rule of thumb feels permanent. Chapter 18 looks at both designs from the inside.
Reading on flash turns out to be easy. Writing is where the odd constraint lives.
3.2Pages and erase blocks
Imagine a notebook where every line can be written once and can never be crossed out. Changing one word on line 40 means writing the corrected line somewhere else and treating the old line as dead. You can only get blank lines back by tearing out a whole section of several hundred lines at a time.
Flash behaves much like that notebook. A flash chip is written in small units called pages, a few kilobytes each. (These are not the 4 KB pages of memory that the page cache is made of. They share a name and nothing else.) A page can only be written when it's empty, which in flash means freshly erased. And erasing can't be done a page at a time. The smallest unit a chip can erase is an erase block, many pages together, several megabytes in all.
The figure shows eight pages of one erase block, six already written and two still free. A real erase block holds hundreds of pages or more, but eight is enough to see the problem.
?So how would a drive overwrite block 7 in place?
It can't. Putting new bytes in a page that already holds old ones would mean erasing it first, and erasing it means erasing every other page in its erase block, which hold other blocks' data. Overwriting one 4 KB page in place is physically impossible without wrecking hundreds of its neighbours.
Yet the filesystem asked for exactly that, and the drive says it did it.
3.3The Flash Translation Layer
The drive's answer is never to overwrite at all. Every SSD has a small processor of its own inside it, called the controller. The controller runs software that ships built into the drive, which is called firmware. One part of that firmware is the Flash Translation Layer, or FTL. The FTL keeps a table that maps each logical block number, the number the filesystem uses, to the physical page where that block's data currently sits. Reads look up the table first. Writes go to a fresh page and then change the table.
To draw this, we'll shrink the drive to two erase blocks of four pages each. Erase block 0 holds four logical blocks: 3 and 5 (the home and jai directories on chapter 08's tiny disk), 7 (your note) and 9 (part of some other file). Erase block 1 is empty. We'll write a page's position as E0·2, meaning erase block 0, page 2. Watch what happens when the note changes to "buy milk, eggs" and the filesystem writes block 7 again.
E0·2, page 2 of erase block 0, next to blocks 3, 5 and 9. Green pages are erased and free.Compare that with the contract from section 1. Underneath an SSD, almost none of it is physically true. Block 7's number is translated to a physical place that has nothing to do with the number, the place moves every time block 7 is written, nobody above the drive is told, and the flash underneath can't overwrite anything at all.
The first item on the bill is already visible in the scene. Each overwrite leaves a dead page behind, and free pages don't come back on their own.
04Taking the space back
4.1Garbage collection
Keep overwriting and the drive runs out of free pages, with its dead pages scattered through erase blocks that also hold live ones. To get free pages back, it has to erase a whole erase block, but erasing a block that still holds live pages destroys data you want. So the controller first copies the live pages somewhere else, then erases. This is garbage collection.
Here is the scene from the last section, a little later. Block 7's new copy is in erase block 1, and erase block 0 holds three live pages and one dead one. The drive wants to get erase block 0's space back.
Garbage collection runs in the background, and it competes with your own requests for the same chips. The time one request takes from start to finish is called its latency, and an SSD's latency can wobble when nothing about your workload has changed, because a read that arrives while the controller is busy copying or erasing may have to wait behind that work.
Those copies are writes to the flash that you never asked for. The question now is how many of them there are.
05Write amplification and wear
5.1Counting the extra writes
In the scene, one page written by the filesystem turned into four page writes inside the drive. The ratio of bytes the flash writes to bytes you asked it to write is called write amplification, and the scene's value was 4. Let's check that the arithmetic isn't specific to our toy.
The erase blocks your drive reclaims are three-quarters live. For each page you write, roughly how many pages does the flash end up writing?
?Why does it get worse as the drive fills?
Because a fuller drive has fewer mostly-dead blocks to choose from. When the controller picks a block to reclaim, the best candidate is the one with the fewest live pages, since that's the one needing the fewest copies. On a drive that's nearly full, even the best candidate is mostly live, so every reclaim copies a lot to gain a little.
That's how a Postgres database can start saving transactions slowly months after launch, with nothing changed but the amount of free space: each transaction ends in an fsync, and each fsync now waits behind more copying. It's also why a benchmark on a fresh, empty drive can look far better than the same drive will a year in.
5.2Write amplification by workload
Write amplification decides two things: how fast the drive can keep up a stream of writes, and how quickly it wears out. How large it gets depends on what you write and how full the drive is. The table needs three more terms. Overprovisioning is spare flash that the drive keeps beyond its advertised size, so garbage collection always has room to work. TRIM is a command the filesystem can send to say "these blocks are no longer used", which lets the drive treat their pages as dead straight away instead of copying them around for nothing. (When you delete a file, only the filesystem knows its blocks are free; without TRIM the drive still thinks they're live.) A write is aligned when it starts and ends on 4 KB boundaries, so it lines up with the 4 KB units the drive keeps track of and never covers only part of one.
| Workload | Typical WA | Why |
|---|---|---|
| Large sequential writes | ~1.0 | Whole erase blocks are filled and retired together |
| Random 4 KB writes, drive half empty | ~2–3 | Blocks hold a mix of live and dead pages |
| Random writes, drive nearly full | 10 or more | Little free space; garbage collection copies constantly |
| Aligned, TRIM'd, overprovisioned | closer to 1 | The controller knows what's dead and has room to work |
The values are typical rather than exact, and they vary between drives. Look at the third row. A nearly full SSD is dramatically slower at writes, and it gets worse faster the closer it gets to full. The arithmetic from the Predict shows why. Blocks that are three-quarters live cost four writes per page you write, but blocks that are nine-tenths live cost ten, because the controller copies nine pages to gain each free one.
5.3Wear
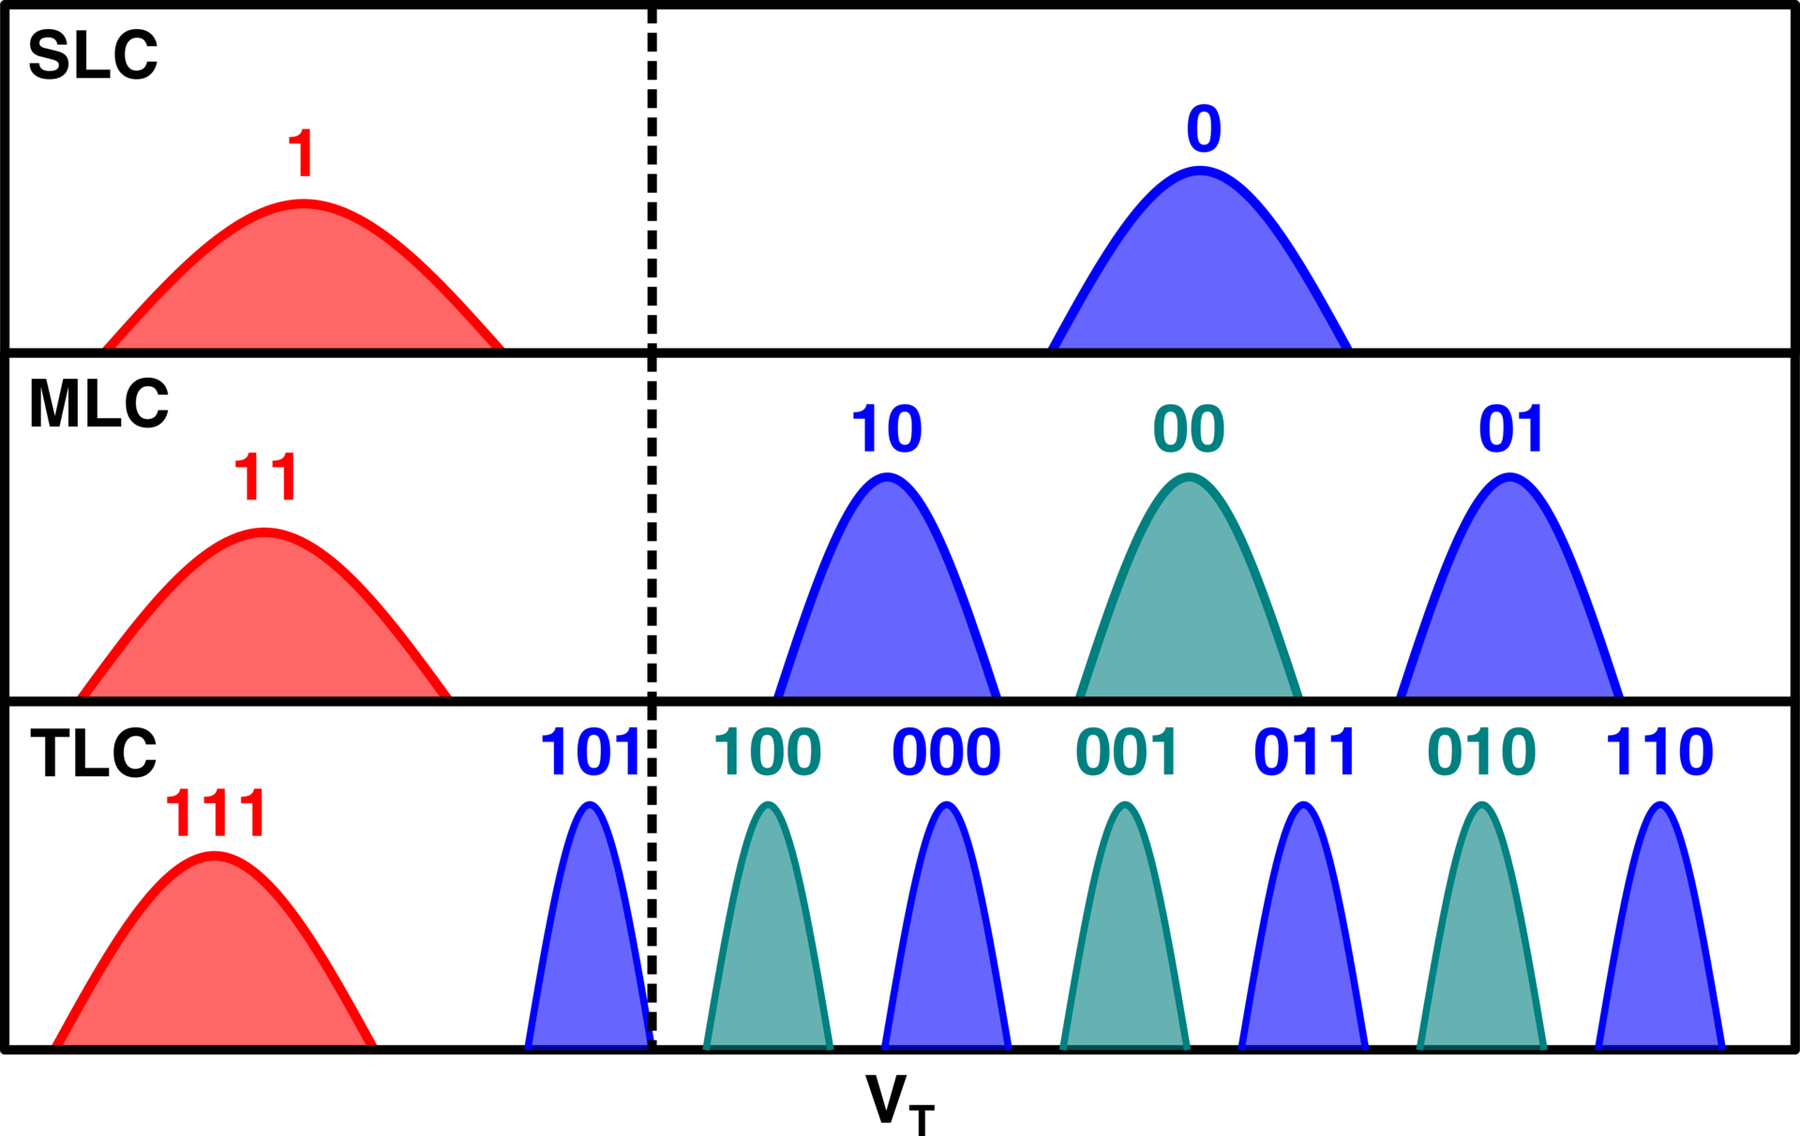
Writing also uses the flash up. Flash stores bits as tiny amounts of electric charge held in cells, and every erase damages a cell a little. Each cell survives only a limited number of erase cycles, roughly 1,000 to 3,000 for consumer TLC flash (which stores three bits in each cell), and more for enterprise parts. To keep any one erase block from dying early, the controller practises wear levelling: it spreads erases evenly across all the erase blocks.
You can see how much wear a drive has taken. The drive reports how much of its life is gone through SMART, its built-in health report. Manufacturers also publish a rating called TBW, the terabytes that may be written to the drive over its life.
The arithmetic is short, and it's worth doing once. A 2 TB drive is rated for 1,200 TBW, and an application writes 500 GB a day: logs, a database's own log, background rewriting of data.
| Drive capacity | 2 TB | |
| Rated endurance | manufacturer TBW | 1,200 TB |
| Application writes per day | logs, database log, rewriting | 500 GB |
| Life if every byte were written once | 1,200 TB ÷ 0.5 TB per day = 2,400 days | ≈ 6.6 years |
| Write amplification | random-ish workload | 3× |
| Actual flash writes per day | 500 GB × 3 | 1.5 TB |
| expected life at that rate | ≈ 2.2 years | |
A drive that should have lasted about six and a half years lasts about two, and nothing in your monitoring says so until SMART starts counting down.
Treat this as the shape of the effect rather than a forecast. Manufacturers work out a TBW rating by running a standard test workload, and that workload has some write amplification of its own already baked in. What shortens a drive's life in practice is a workload whose amplification is much worse than the one the rating assumed, such as small random writes on a nearly full drive.
Everything in this section and the last one happens inside the drive. Now we turn to what a request looks like on its way in, and why the same drive can look fast or slow depending on how you ask.
06How requests reach the flash
6.1One read, down to the flash
Modern SSDs talk to the operating system using NVMe, a protocol designed for flash. The SSD plugs into PCIe, the fast connection inside a computer that also carries graphics cards, and NVMe is the language spoken across it. NVMe's central idea is the queue: a fixed number of request slots in memory, used in a circle, which the kernel and the drive can both see. The kernel writes requests into the slots, and the drive reads them out.
Here's one pread() of block 7 that misses the page cache, from your thread down to the flash and back:
Every step on that path costs something, and most of the costs don't depend on how much data is being read. The syscall, the block layer, the queue entry, the FTL lookup and the completion are paid in full whether the request is for 4 KB or for 4 MB. That should make small reads look expensive per byte, and they do.
6.2Why small reads waste the device
Here is the time a read takes as its size grows, one read at a time, from a 3 GB file with the page cache bypassed. The 4 KB row, about 45 µs, lands between section 3's sequential and random figures. Absolute times like these shift with the offsets being read and with how busy the drive is, so the useful comparison is between the rows of this one table.
| Read size | ns per read | MB/s | Efficiency |
|---|---|---|---|
| 4 KB | 44,937 | 91 | Fixed overhead dominates |
| 16 KB | 56,076 | 292 | 4× data, 1.25× time |
| 64 KB | 95,209 | 688 | Getting somewhere |
| 256 KB | 135,215 | 1,939 | Device starting to stretch |
| 1 MB | 373,637 | 2,806 | |
| 4 MB | 1,162,609 | 3,608 | 40× the throughput of 4 KB |
Look at the first two rows. Four times as much data takes only 1.25 times as long, because the fixed cost of the round trip from the last subsection is the biggest part of a 4 KB read. By 4 MB the same fixed cost is a small part of the total, and the throughput is forty times higher from read size alone: same device, same file, same one-at-a-time access. A 4 KB read pays for the whole round trip to move almost nothing.
Reading in bigger pieces helps, but sometimes the pieces have to be small. The other way to hide a fixed cost is to pay it for many requests at once, and the drive is built for that.
6.3Queue depth
Inside the drive, the flash chips are wired in several independent groups called channels, and each channel can be working on a different request at the same time. A single read occupies one channel, so a thread that sends one request and waits for the answer keeps only one channel busy while the others sit idle.
The number of requests in flight at once is the queue depth. A single-threaded loop of blocking pread calls has a queue depth of one, because each call waits for its answer before the next one starts. To get more than one request in flight, a program can use several threads, each with its own blocking read, or asynchronous I/O, where the program hands the kernel a request and carries on without waiting for the answer. Here are four reads, first at depth one and then at depth four, on a toy drive with four channels:
The total amount of work a device gets through per second is its throughput. The scene shows why queue depth is the variable that matters most when you measure a drive: at depth one, the throughput you see is set by the latency of one request, and the rest of the drive sits idle. So a test at depth one measures latency, even if you believe you're measuring throughput.
NVMe was designed with this in mind. Older drives use the SATA connection, which was built around a spinning disk with a single arm, where the drive can serve only one request at a time. SATA offers a single queue of 32 entries. NVMe offers far more:
| Interface | Queues | Entries per queue | Designed for |
|---|---|---|---|
| SATA | 1 | 32 | A spinning platter, where a deeper queue had little to gain |
| NVMe | Up to 65,535 | Up to 65,536 | Flash over PCIe, with doorbells the kernel writes to directly |
?Why do rated IOPS look so far from what you measure?
IOPS means I/O operations per second, and it's the number on a drive's box. Rated figures are measured with deep queues, because that's the only way to keep every channel busy. A drive rated at a million IOPS delivers perhaps twenty thousand at queue depth one: if each 4 KB read takes about 45 µs, one thread can finish about 22,000 of them in a second. Both numbers are honest. They answer different questions.
Real throughput needs depth. You get it from many threads, from asynchronous I/O, or from io_uring, the Linux interface from chapter 07 that lets a program queue many requests with one syscall. Notice that io_uring's pair of queues, one for requests and one for results, has the same shape as NVMe's submission and completion queues.
So far we've assumed the drive does what it says. It doesn't always.
07Where the abstraction leaks
7.1The write cliff
A fresh SSD is mostly erased flash, so garbage collection has little to do and writes are fast. It doesn't stay that way. Sustained random writes use up the free space and the overprovisioned space, garbage collection has to run continuously, write amplification rises as in section 5, and throughput can drop by an order of magnitude and stay there. This sudden drop is called the write cliff.
7.2Devices that lie about flushing
The second leak is about the safety you were promised in chapter 08. fsync is supposed to return only once the data is durable, but the kernel can only be as sure as the drive lets it be. Many drives have a volatile write cache, a small amount of fast memory on the drive that loses its contents without power. They acknowledge a write the moment it lands there, which is faster than waiting for the flash. To force the cache's contents onto the flash, the kernel sends a flush command (FLUSH CACHE on SATA drives, Flush on NVMe), and the drive is supposed to answer only when the flush is done.
?Why do enterprise drives cost more?
Partly for this. They have power-loss protection: a capacitor that stores enough energy to copy the cache onto the flash after the power fails. That capacitor is a meaningful part of the price, and it's what makes the drive's acknowledgement trustworthy.
Now that we've followed block 7 from the filesystem to the chips and found where each cost comes from, it's worth putting the numbers next to each other.
08What it all costs
8.1Random against sequential
These figures are for a laptop SSD reading a 3 GB file with the page cache bypassed, one 4 KB read at a time. The exact values vary between drives, but the shape holds across flash: random access costs a small multiple of sequential access.
On a 7,200 rpm spinning disk the same ratio was roughly a hundred, because a random read meant a seek and a wait for the platter. Section 2's advice was tuned to that number.
8.2What small reads cost over a whole file
The sweep in section 6 turns into a realistic calculation. Say your program needs to read 4 MB from the drive, one read at a time, with nothing cached.
| 4 MB read as 4 KB pieces | 1,024 reads × 44,937 ns | 46 ms |
| The same 4 MB as one read | 1 × 1,162,609 ns | 1.2 ms |
| Throughput at 4 KB per read | 4,096 B ÷ 44,937 ns | 91 MB/s |
| Throughput at 4 MB per read | 4,194,304 B ÷ 1,162,609 ns | 3,608 MB/s |
| less waiting from read size alone | ≈ 40× | |
Nothing about the drive changed between the two rows. The program that read in small pieces paid for the round trip from section 6.1 1,024 times instead of once.
09Watching the device
9.1What to watch
Each question this chapter raised has a tool that answers it on a running machine.
# Latency, queue depth and utilisation per device. Start here. (sections 5 and 6)
iostat -xz 1                   # await, aqu-sz, %util, r/s, w/s

# Where is the time: device or queue? (section 6; Linux bcc tools, chapter 48)
biolatency-bpfcc               # histogram of device service time
biosnoop-bpfcc                 # per-I/O, with process attribution

# Drive health and how much life is left (section 5.3)
smartctl -a /dev/nvme0n1 | grep -E 'Percentage Used|Data Units Written'
nvme smart-log /dev/nvme0n1

# macOS
iostat -w 1
sudo fs_usage -f diskio
aqu-sz in iostat is the number to check first. It's the average queue depth from section 6.3. A queue depth near 1 with poor throughput means your application isn't giving the device enough work, and no amount of faster hardware will help. A depth of 30 with rising await (the average time a request waits and is served) means the device is the bottleneck.
9.2Rules that hold up
- Bigger reads and writes. About 40× is available for free if your access pattern allows it (section 6.2).
- More depth. Threads, asynchronous I/O or io_uring. A blocking single-threaded loop uses a fraction of an NVMe drive (section 6.3).
- Keep 10–20% free. Write amplification climbs sharply on a full drive (section 5).
- Enable TRIM so the controller knows which pages are dead. Running
fstrimon a timer is the usual arrangement on Linux. - Align to 4 KB. A write that straddles a page boundary can touch two flash pages instead of one.
- Precondition before you benchmark, and buy power-loss protection when
fsynchas to mean it (section 7).
9.3What you trade for what
| You get | You pay | When the bill arrives |
|---|---|---|
| A flat array of persistent blocks | An FTL doing invisible work underneath | As latency variance during garbage collection |
| Random I/O only 4.7× worse than sequential | Advice tuned for spinning disks is now out of date | As an over-engineered sequential design |
| Enormous parallelism via NVMe queues | Only if you supply queue depth | At 91 MB/s from a drive rated for thousands |
| Wear levelling and transparent remapping | Write amplification, and a finite life | Two years in, per the arithmetic in section 5.3 |
| Fast acknowledged writes | A volatile cache that may ignore flushes | On power loss, on consumer hardware |
9.4Symptom, cause, fix
| Symptom | Likely cause | Fix |
|---|---|---|
Throughput far below the rating, aqu-sz near 1 | Queue depth of one | Threads, async I/O or io_uring |
| Small reads slow, device looks idle | Fixed per-request cost dominates | Read in larger chunks |
| Writes slow down months after launch | Drive filling up; write amplification climbing | Keep 10–20% free, enable TRIM |
| Benchmark great, production much slower | Fresh drive, no garbage collection pressure | Precondition before measuring |
| SMART life dropping faster than expected | Write amplification multiplying your writes | Do the TBW arithmetic; cut random writes |
Data lost after power cut despite fsync | Drive ignored the flush | Drives with power-loss protection |
10Summary
- A block device is a flat array of numbered blocks.
diskutilshowed 4,096-byte blocks, and the filesystem trusts the promise that block 7 is one fixed place. - The promise was built for spinning disks, where block 7 is a spot on a platter and random access costs a seek and a rotation, about 100× slower than sequential.
- On flash, random reads are only about 4.7× slower. Most "avoid random I/O" advice now overstates the cost.
- Flash writes pages but erases whole erase blocks, so it can't overwrite in place.
- The FTL never overwrites. It writes the new data to a fresh page, updates its map, and marks the old page dead.
- Garbage collection copies live pages before it erases a block, and the copies are writes you never asked for.
- Write amplification is the ratio of flash writes to your writes, about 4 when reclaimed blocks are three-quarters live, and it climbs as the drive fills. Keep 10–20% free.
- Write amplification also wears the drive out. At 3× it turned a drive worth about six and a half years into about two.
- Fixed per-request costs make small reads waste the device. Reading 4 MB at once is about 40× better than reading it 4 KB at a time.
- Queue depth decides what you measure. At depth one you see latency, and the drive's parallelism sits idle.
- Some drives acknowledge writes they haven't made durable. Power-loss protection is a hardware purchase.
11Build this
Find your device's real shape, then find out how much of it you were using.
- Sweep read size from 4 KB to 4 MB at queue depth 1, bypassing the page cache (
F_NOCACHEon macOS,O_DIRECTon Linux). Plot throughput. You should see something like the 40× above. - Now hold size at 4 KB and sweep queue depth from 1 to 64 using threads or
io_uring. Plot throughput again. - Compare the two curves. Depth probably buys you more than size does, and neither on its own gets you near the number on the box.
Then run fio, a standard storage benchmark program, with the same parameters and see how close your numbers are. If they differ a lot, the interesting work is finding out why.
12Interview questions
beginnerWhy can't an SSD overwrite a block in place?›
Flash is written in pages of a few kilobytes but erased only in erase blocks of megabytes, and a page must be erased before it can be written again. So changing 4 KB in place would mean erasing several megabytes, including everything else stored there.
The controller writes your new data to a fresh page, updates its mapping table, and marks the old page dead. Garbage collection later copies the surviving pages out of an erase block and erases it.
intermediateWhat is write amplification and why should you care?›
It's the ratio of bytes written to flash against bytes your application wrote. Reclaiming space means copying live pages out of erase blocks that are about to be erased, so the drive does extra writing on your behalf.
It matters twice: it caps sustained write throughput, and it uses up endurance. A workload writing 500 GB a day at 3× amplification puts 1.5 TB a day on the flash, which turns a drive rated for 1,200 TBW into roughly a two-year part.
intermediateYour NVMe drive is rated for a million IOPS and you're getting 20,000. What's wrong?›
Queue depth, almost certainly. A single-threaded loop of blocking pread calls has one request outstanding, so you're measuring latency while most of the drive's channels sit idle. At about 45 µs per 4 KB read, one thread tops out near 22,000 reads a second, which is the number you're seeing.
Rated IOPS figures assume deep queues. Get depth with threads, asynchronous I/O or io_uring. Check aqu-sz in iostat: near 1 means the application is the bottleneck, not the hardware.
deepHow much slower is random I/O than sequential, and how has that changed?›
On a laptop NVMe drive, a 4 KB random read took about 120.8 µs against 25.7 µs sequential, one read at a time, which is about 4.7×. On a 7,200 rpm disk the ratio was roughly 100×, because random meant a seek plus waiting for the platter to rotate.
A change that large alters design decisions. Design advice built around "random I/O is catastrophic" is now overcautious, and it's part of why B-trees became competitive with LSM-trees again: the conversion from random to sequential writes that LSMs perform is worth far less than it used to be.
deepYour storage benchmark looked great and production is much slower. Name three likely reasons.›
First, preconditioning. A fresh drive has plenty of erased blocks and no garbage collection pressure. After sustained random writes, throughput can drop by an order of magnitude and stay there, and a benchmark that runs thirty seconds on a new drive shows only the best case.
Second, free space. Write amplification climbs sharply past roughly 80–90% full, and production drives are fuller than test ones.
Third, queue depth and read size. The same drive delivers about 91 MB/s at 4 KB per read and about 3,608 MB/s at 4 MB per read, one read at a time, which is 40× from read size alone. If the benchmark used large sequential reads and production does small random ones, you're comparing two different devices.
13Go deeper
Your SSD is 95% full and writes got slow. Why?›
Write amplification. Little free space means garbage collection copies live pages constantly to reclaim erase blocks. Keep 10–20% free.
Rated for a million IOPS, you measure 20,000. First thing to check?›
Queue depth. A blocking single-threaded loop keeps one request outstanding and leaves the device's parallelism idle.
Roughly how much does read size matter at fixed queue depth?›
About 40× between 4 KB and 4 MB on a laptop SSD: 91 MB/s against 3,608 MB/s.
fsync returned success on a consumer SSD. Is the data safe from power loss?›
Not necessarily. The drive may have acknowledged into a volatile write cache. Power-loss protection is a hardware feature you pay for.
Hard disk drives (seek, rotation and why sequential wins) and flash-based SSDs (pages, erase blocks, the FTL and garbage collection), built up one step at a time. Free online at ostep.org.
The standard storage benchmark. Precondition properly, sweep queue depth and block size, and it will tell you what your device does.
A six-part series on the FTL, write amplification and access patterns. The clearest free explanation of why SSDs behave as they do.
Shorter and more readable than you'd expect. The submission and completion ring design invites comparison with io_uring's.
Device service time as a histogram, and per-I/O attribution to processes. Separates "the device is slow" from "we are asking badly".
14Related chapters
The layer above this one: the page cache, fsync and the rename dance.
Chapter 08.
The per-call cost, interrupts, and io_uring, the easy way to get queue depth. Chapter 07.
Where biolatency and biosnoop come from. Chapter 48.