You type shop.example.com into a browser and press Enter. Before anything is sent, the browser asks the DNS system to turn that name into an IP address, the number that identifies a machine on the network, something like 203.0.113.7. Then it opens a connection to that address and asks for the page. Every other shopper on the site gets the same address back and connects to it too.
One machine can answer only so many requests a second, so a site with real traffic runs the same program on many servers. We'll use four, s1 to s4. The shopper's browser knows nothing about them. It was given one address, and it sends its request there. Somebody has to be listening at that address, take each request, and hand it to one of the four servers, and that choice is harder than it looks. If requests keep going to a server that's already busy, shoppers wait while another server sits idle. If one server crashes, every request sent to it fails. And when the team deploys a new version, each server has to be taken out of service and put back without a shopper noticing.
The thing that listens at the shared address and makes the choice is a load balancer. This chapter asks one question about it: when thousands of requests a second arrive at one address, how does each one end up at a server that can handle it, and how does that keep working while servers are slow, broken or being replaced? We'll start by simulating a few ways to choose, to find out whether the rule matters at all. Then we'll follow the traffic down from the network edge to the servers, and see what happens when s4 goes wrong and when we have to replace it.
01Simulate four ways to pick a server
1.1Same fleet, four rules
Before building anything, let's check whether the rule for choosing a server matters. The simulation uses ten servers instead of four, because the differences show up more clearly with more of them.
Each server handles one request at a time and takes about 1 millisecond per request on average (some requests take longer, some shorter). Requests arrive at random moments, at a pace that keeps the fleet 80% busy. A request that arrives while its server is busy waits behind the others, and that line of waiting requests is the server's queue. The time a user experiences is the wait in the queue plus the time to be served. We'll record it for 200,000 requests and report two numbers. The mean is the ordinary average. The p99 is the time that 99 out of every 100 requests beat, so one request in a hundred is slower than that.
For choosing, picture a supermarket with ten checkouts. You could join a queue at random and hope. You could walk to the next checkout in order. You could glance at two queues and join the shorter. Or, if you could see all ten at once, you could join the shortest. Those are the four rules we'll test, and the technical names are random, round robin (each server in turn), two random choices (look at two servers picked at random and take the one that will be free sooner) and least loaded (look at all of them and take the one that will be free soonest).
In the code, free_at[s] is the moment server s will finish everything already waiting for it. A request that arrives at time t starts at max(t, free_at[s]), so it waits if the server is still busy, and then takes a random time with a mean of 1 ms. Save the script as lb.py. It uses only the standard library, and the fixed random seed means you'll get exactly the numbers below.
import random

def simulate(policy, servers=10, requests=200_000, load=0.8, seed=3):
    rng = random.Random(seed)
    free_at = [0.0] * servers                      # when each server finishes its queue
    t, lat = 0.0, []
    rate = load * servers                          # arrivals per ms (mean service time = 1 ms)
    for i in range(requests):
        t += rng.expovariate(rate)
        if policy == "random":
            s = rng.randrange(servers)
        elif policy == "round robin":
            s = i % servers
        elif policy == "two random choices":
            a, b = rng.sample(range(servers), 2)
            s = a if free_at[a] <= free_at[b] else b
        else:                                      # least loaded: the server that frees up first
            s = min(range(servers), key=free_at.__getitem__)
        start = max(t, free_at[s])
        free_at[s] = start + rng.expovariate(1.0)
        lat.append(free_at[s] - t)
    lat.sort()
    return sum(lat) / len(lat), lat[int(0.99 * len(lat))]

print(f"{'policy':<20}{'mean':>9}{'p99':>10}")
for p in ("random", "round robin", "two random choices", "least loaded"):
    m, q = simulate(p)
print(f"{p:<20}{m:7.2f} ms{q:8.2f} ms")policy mean p99
random 5.12 ms 23.85 ms
round robin 2.91 ms 13.20 ms
two random choices 1.75 ms 6.21 ms
least loaded 1.21 ms 4.93 msLook at the two ends first. Random assignment gave a p99 of 23.85 ms and least loaded gave 4.93 ms, nearly five times better, with the same servers and the same traffic. The only difference is which server each request was sent to. Random does badly because it looks at nothing, so by chance some server gets a burst while another sits idle. Round robin gives every server the same number of requests, but requests differ in length, so equal counts still leave some servers with more work, and it lands in between at 13.20 ms.
The third row is the surprising one. Looking at just two random servers and taking the shorter queue got most of the way to the best result, with a p99 of 6.21 ms.
1.2What the rules assume
Least loaded wins here because the simulation lets it read every server's backlog, instantly and for free. A real balancer can't do that. To know every queue at every moment, it would have to ask every server, and each answer is out of date by the time it arrives. Two random choices needs the backlog of only two servers, which is why popular balancers such as Envoy and HAProxy offer it, and it came within 1.3 ms of the best p99 above.
All four rules also assume the servers are equally healthy. When one is slow or broken, the rule decides how much damage it does, and sections 4 and 5 come back to that. First we need to know what a balancer in front of a real site can see of the traffic, because that decides which of these rules it can use at all.
02What a load balancer decides
2.1Three jobs in one decision
To see what a balancer can know, start with what it has to do. Our shop's address, 203.0.113.7, belongs to the balancer. Clients know it, and it isn't tied to one machine, so it's called a VIP, a virtual IP. The servers behind it, s1 to s4, are the backends. For each new piece of work, the balancer makes one decision: which backend gets it.
That one decision carries three jobs:
| Job | What it means | What goes wrong without it |
|---|---|---|
| Spread load | Keep every backend about equally busy | One server saturates while others idle |
| Hide failures | Stop sending work to backends that can't do it | Some fraction of users see errors |
| Allow change | Add, remove and replace backends without clients noticing | Every deploy or scale-down drops connections |
The jobs pull against each other. Hiding failures means reacting fast when a signal looks bad. Allowing change means leaving alone any traffic that's fine where it is. Most of the rest of the chapter is about that tension.
2.2Layer 4 or layer 7
How much the balancer can know depends on how much of each message it reads. A browser's request travels as packets, small chunks of data that each carry the sender's and receiver's IP addresses and a port, a number that says which program on the machine should receive it. The packets of one TCP connection, the two-way conversation that TCP keeps reliable and in order, are called a flow. Inside the packets' payload sits the HTTP request itself.
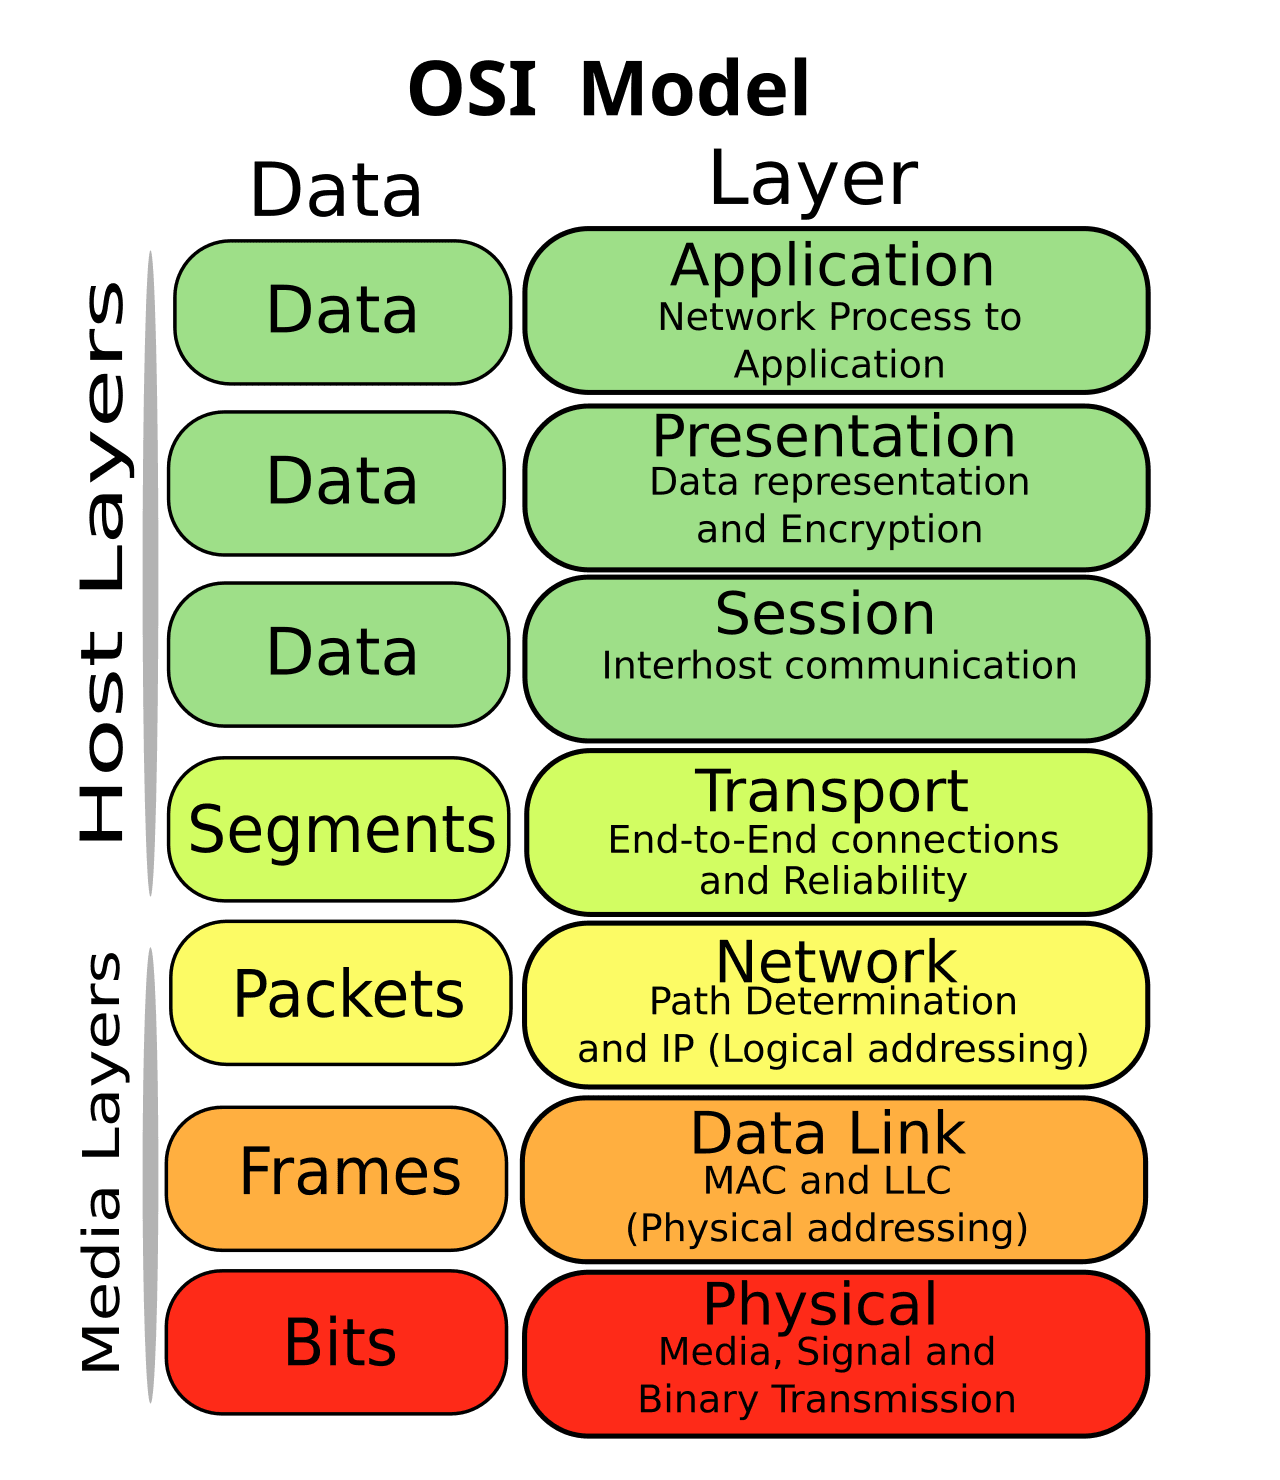
Network engineers describe this stack as seven layers, and two of them matter here. At layer 4, the transport layer (TCP and UDP), a balancer sees addresses and ports and nothing else. At layer 7, the application layer, it can read the HTTP request: the method, the path, the headers. People shorten the two kinds to L4 and L7. One more term appears in the table. Web traffic is usually encrypted with TLS, so a balancer that wants to read requests has to decrypt them first, which is called terminating TLS.
| Layer 4 (transport) | Layer 7 (application) | |
|---|---|---|
| Sees | IP addresses, ports, TCP/UDP | HTTP method, path, headers, gRPC service |
| Unit it balances | A connection (a flow of packets) | A request |
| TLS | Passes it through | Usually terminates it |
| Cost per unit | Tiny: a hash and a table lookup per packet | Parse, maybe decrypt, route, re-encrypt |
| Examples | AWS NLB, Google Maglev, Facebook Katran, IPVS, kube-proxy | AWS ALB, Envoy, nginx, HAProxy in mode http |
| Can do | Millions of packets a second per core, any protocol | Retries, path routing, header rewrites, per-request balancing |
The examples are real systems: Amazon's Network and Application Load Balancers (NLB and ALB), Google's Maglev, Facebook's Katran, Linux's built-in IPVS, Kubernetes' kube-proxy (more on it in a moment), and the proxies Envoy, nginx and HAProxy. gRPC, in the first row, is a protocol for calls between services, and it too is coming up shortly.
?Why do large sites run both?
Because each is good at what the other can't do. An L4 tier can take a huge packet rate and spread it across a fleet of L7 proxies without understanding any of it. Those L7 proxies then make the per-request decisions. Google's Maglev paper describes exactly that stack, and Cloudflare, Facebook and GitHub run the same shape.
The difference between the layers bites in one common case. Kubernetes runs programs in pods, and a Service gives a group of pods one stable address. A component called kube-proxy, running on every machine in the cluster, balances connections to that address at L4. gRPC is built on HTTP/2, which multiplexes: it sends many requests at once over one long-lived connection.
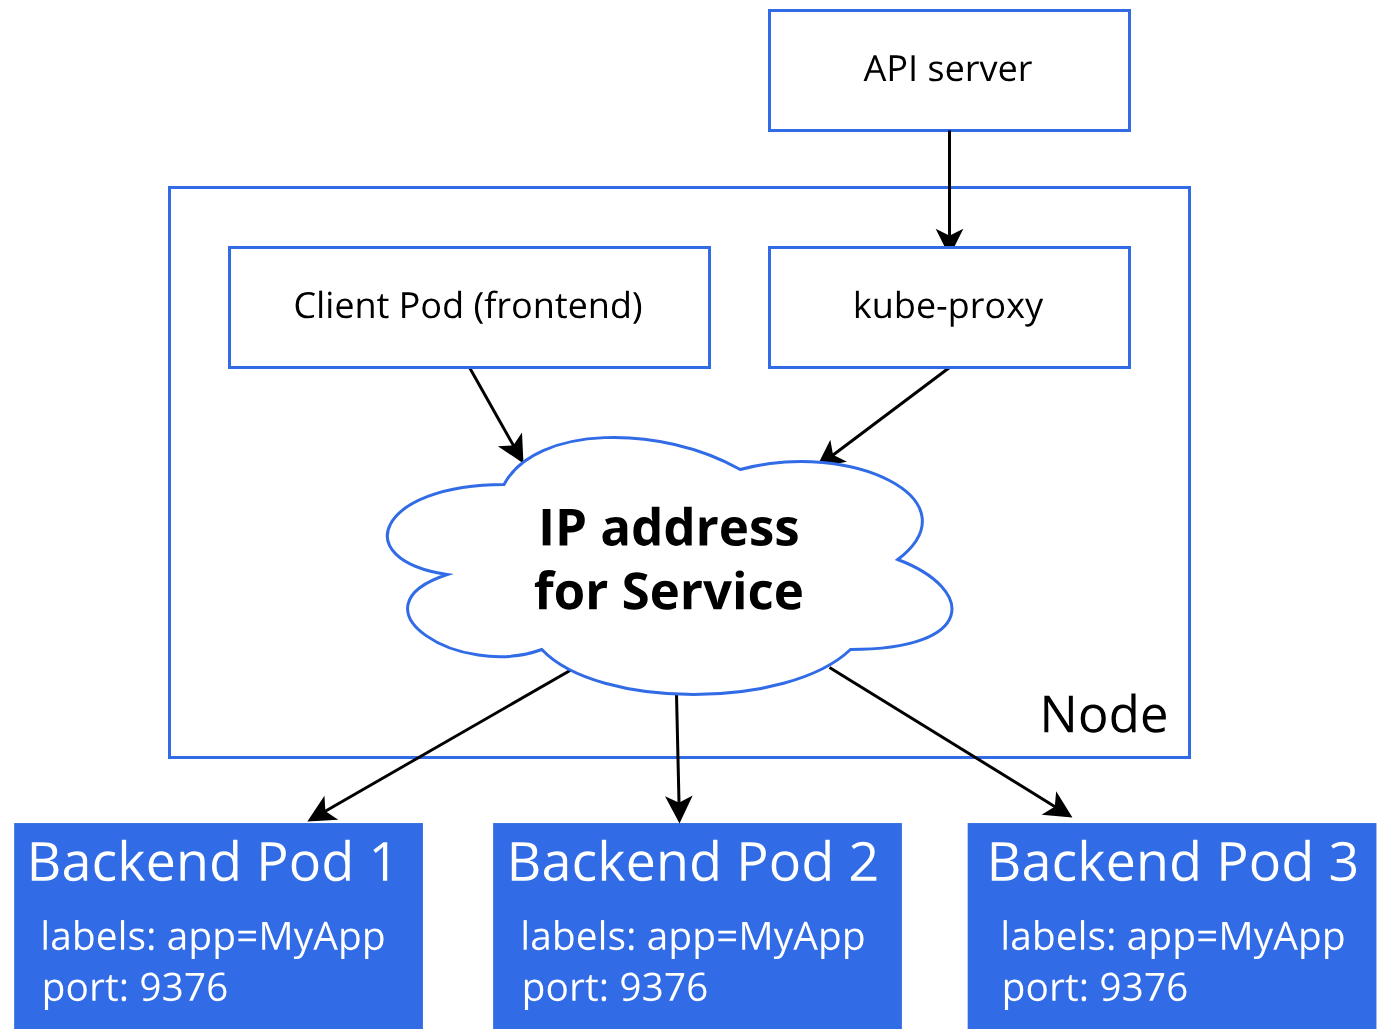
A gRPC client opens one HTTP/2 connection to a Kubernetes Service backed by five pods, then sends 10,000 requests over it. How are the requests spread?
L4 is where traffic first arrives at a big site, so we start there. At the top, the problem is sheer volume.
03Layer 4: spreading packets
A busy VIP might receive tens of gigabits a second, more than any one machine can handle. So the spreading has to start in the network itself, before any single balancer machine sees a packet.
3.1ECMP: the router spreads the load
Packets reach the VIP through a router, a device that forwards each packet toward the next device on its way, called the next hop. Suppose we run several balancer machines, and each one tells the router "I can deliver the VIP". (Machines announce what they can reach with a routing protocol called BGP.) The router now has several next hops that reach the VIP at the same cost, and routers have a feature for exactly that situation: equal-cost multi-path routing, or ECMP. With several equal next hops, the router picks one for each packet.
How should it pick? Alternating between them would balance the count, but the packets of one connection would be scattered across machines, and might even arrive out of order. So the router picks by hashing some fields of the packet, which means running them through a function that turns any input into a number that looks random but is always the same for the same input. The fields are the 5-tuple: source IP, source port, destination IP, destination port and protocol. Every packet of a connection has the same 5-tuple, so they all hash to the same next hop and travel the same way. RFC 2992 analyses the common "hash-threshold" method.
That lets a whole fleet of balancers announce the same VIP at equal cost, with the router spreading flows across them. Google's balancer for its own traffic is called Maglev, and its authors describe moving to this design from active-passive pairs (one machine working, one waiting in reserve): "we can multiply the capacity of a VIP by the maximum ECMP set size of the routers, and all machines can be fully utilized."
The router has now chosen a balancer machine. That machine still has to choose one of s1 to s4 and get the packet there.
3.2From the balancer machine to a backend
There are three ways to deliver a packet to the chosen backend, and they differ in what the backend sees and in where the reply goes. With NAT (network address translation), the balancer rewrites the packet's destination from the VIP to the backend's own address. With a tunnel, it wraps the whole original packet inside a new packet addressed to the backend, which is called encapsulation, and the backend unwraps it. GRE, IP-in-IP and GUE are formats for that wrapping. With a proxy, the balancer ends the client's connection and opens a second one to the backend.
| Method | How it works | Client IP at the backend | Return traffic |
|---|---|---|---|
| NAT (IPVS NAT, kube-proxy, NLB by default) | Rewrite the destination to the backend's IP | Preserved, unless source NAT is added too | Must come back through the balancer to be un-rewritten |
| Tunnel + DSR (Maglev, Katran, GLB) | Encapsulate (GRE, IP-in-IP, GUE); backend decapsulates | Preserved | Direct to the client |
Proxy (any L7, and L4 proxies like HAProxy mode tcp) | Terminate the connection, open a new one | Lost; pass it in X-Forwarded-For or the PROXY protocol | Through the proxy |
Read the table one row at a time. With NAT, only the destination is rewritten, so the backend still sees the client's address as the sender. Its reply goes to the client with the backend's own address as the source, and the client would drop a reply from an address it never contacted, so the reply has to pass back through the balancer, which changes the source back to the VIP. Some setups also rewrite the source to the balancer's address (source NAT), which guarantees the reply comes back but hides the client. With a proxy, the backend sees the proxy's address as the sender. The proxy can pass the real client address along in an HTTP header called X-Forwarded-For, or in a small prefix called the PROXY protocol. In the tunnel row, DSR stands for direct server return: the backend sends its reply straight toward the client instead of back through the balancer.
?Why doesn't the load balancer need to see replies?
With DSR, a load balancer only handles the small inbound half of each connection. Maglev's paper puts the reason plainly: DSR means "Maglev does not need to handle returning packets, which are typically larger in size." The price is that the balancer never sees the server's side of the conversation, including the packets that close the connection.
Here is one packet's whole trip through the tunnel and DSR design, which is the one Maglev uses. The first packet of a TCP connection is called a SYN, and that's the one we follow.
3.3The problem: the set changes
That trip worked because the router and the balancer each chose from the packet's 5-tuple, and every later packet repeats the same two choices. Both choices have the same weakness: they assume the set they're choosing from stays the same.
The router's hash keeps a flow on one balancer machine only while the set of next hops is stable. Add a balancer machine, or lose one, and the hash maps some existing flows to a different machine, which has never seen them.
The same thing happens one level down. Say each balancer picks a backend with hash(5-tuple) % N, where % is the remainder after dividing and N is the number of backends. This is called modulo. It spreads flows well, and it falls apart when N changes. Here are eight connections, labelled by their hash (real hashes are huge numbers, and we're using small ones so we can follow each connection), spread over our four servers and then losing s4:
hash % 4: hash 0 goes to s1, 1 to s2, 2 to s3, 3 to s4, and then 4 wraps around to s1 again. Every server has two connections.?Can't the new machine just look up the connection?
Only if every balancer machine shares its connection table with every other, and keeping those tables in sync at millions of packets a second is exactly what these designs avoid. Instead, they make the backend choice a function of the packet: any balancer machine that sees the same 5-tuple computes the same backend, with no need to have seen the connection before. What's left is to choose a function where a change in the set of backends moves as few flows as possible. A hashing scheme with that property is called consistent hashing. Maglev uses both ideas: a local connection table for flows a machine has already seen, and consistent hashing so that a different Maglev machine makes the same choice for flows it hasn't.
The next subsection builds that function.
3.4Maglev hashing
The trouble with hash % N is that N changes. So divide by something that never changes: a lookup table with a fixed number of slots, M, where each slot holds the name of a backend. A flow's slot is hash % M, and its backend is whatever the slot holds. Backends coming and going no longer changes any flow's slot. It changes only which backend some slots name. If we fill the table so that a departing backend's slots go to others and every other slot keeps its backend, only the flows that were on the departing backend will move.
The clever part is the filling. In the Maglev hashing algorithm, each backend has its own preference order: a shuffled list of every slot number, generated from two numbers that come from hashing the backend's name. The first, the offset, is its first-choice slot. The second, the skip, says how far to step for each next choice, wrapping around at the end. The table size M is a prime number, and a prime has a useful property: with any skip from 1 to M − 1, the stepping visits every slot exactly once before it repeats. So each preference list is a complete shuffle. Then the backends take turns, and on its turn a backend claims its most-preferred slot that's still empty. That repeats until the table is full.
Here is the algorithm on a table small enough to follow by hand: seven slots and three backends, B0, B1 and B2.
B0 has offset 3 and skip 4, so it starts at slot 3 and steps by 4, wrapping past 6: 3, 0, 4, 1, 5, 2, 6. B1 has offset 0 and skip 2. B2 has offset 3 and skip 1.Because the backends take turns, each ends up with either ⌊M/N⌋ or ⌈M/N⌉ of the M slots, so the load is nearly equal. The paper notes that and recommends "M to be larger than 100 × N to ensure at most a 1% difference". The paper's experiments use a table of 65,537 slots, a prime, and Envoy's default table size is the same (maglev.proto). A lookup for a new flow is one hash and one array read: table[hash(5-tuple) % M].
Envoy's implementation of the paper's Pseudocode 1 is short enough to read. It's the same loop as the scene, with weights added so a backend can claim a larger share:
  // Implementation of pseudocode listing 1 in the paper (see header file for more info).
    table_build_entries.emplace_back(host, HashUtil::xxHash64(key_to_hash) % table_size_,
                                     (HashUtil::xxHash64(key_to_hash, 1) % (table_size_ - 1)) + 1,
                                     weight);
  // ...
  // Iterate through the table build entries as many times as it takes to fill up the table.
  uint64_t table_index = 0;
  for (uint32_t iteration = 1; table_index < table_size_; ++iteration) {
    for (uint64_t i = 0; i < table_build_entries.size() && table_index < table_size_; i++) {
      TableBuildEntry& entry = table_build_entries[i];
      // ... skip this round if the host's weight says it's had its share ...
      entry.target_weight_ += max_normalized_weight;
      uint64_t c = permutation(entry);
      while (table_[c] != nullptr) {
        entry.next_++;
        c = permutation(entry);
      }

      table_[c] = entry.host_;
      entry.next_++;
      entry.count_++;
      table_index++;
    }
  }

uint64_t MaglevTable::permutation(const TableBuildEntry& entry) {
  return (entry.offset_ + (entry.skip_ * entry.next_)) % table_size_;
}
The offset and skip in the first lines are the two numbers from hashing the host's name, and permutation is the stepping rule from the scene: offset plus skip times how many choices the backend has used so far.
Now let's measure it at a realistic scale, and compare it with two alternatives. Plain modulo is the one we just watched fail. A hash ring is the classic form of consistent hashing: each backend is placed at 100 pseudo-random points on a circle (its "virtual nodes"), and a flow goes to the backend owning the next point after the flow's hash. The script below sends 500,000 random flow hashes through each scheme with 10 backends and with 100, then removes one backend and counts two things. One is how evenly the flows spread before the removal, as the busiest and idlest backend relative to a perfect equal share. The other is how many flows end up on a different backend afterwards, and how many of those moved needlessly, meaning their own backend was still alive.
import hashlib, random, bisect

def h(name, seed):
    d = hashlib.blake2b(f"{name}/{seed}".encode(), digest_size=8).digest()
    return int.from_bytes(d, "big")

def maglev(backends, M=65537):
    offset = {b: h(b, 1) % M for b in backends}
    skip   = {b: h(b, 2) % (M - 1) + 1 for b in backends}
    nxt = {b: 0 for b in backends}; table = [None] * M; filled = 0
    while True:
        for b in backends:                      # Pseudocode 1 in the Maglev paper
            c = (offset[b] + nxt[b] * skip[b]) % M
            while table[c] is not None:
                nxt[b] += 1; c = (offset[b] + nxt[b] * skip[b]) % M
            table[c] = b; nxt[b] += 1; filled += 1
            if filled == M: return lambda k: table[k % M]

def modulo(backends):
    return lambda k: backends[k % len(backends)]

def ring(backends, vnodes=100):
    points = sorted((h(f"{b}#{v}", 3), b) for b in backends for v in range(vnodes))
    keys = [p for p, _ in points]
    def pick(k):
        i = bisect.bisect(keys, k) % len(points)
        return points[i][1]
    return pick

rng = random.Random(7)
flows = [rng.getrandbits(64) for _ in range(500_000)]      # random 64-bit flow hashes

for n in (10, 100):
    backends = [f"b{i}" for i in range(n)]
    gone = backends[n // 2]
    left = [b for b in backends if b != gone]
    for name, make in (("modulo", modulo), ("ring, 100 vnodes", ring), ("maglev M=65537", maglev)):
        before, after = make(backends), make(left)    # tables built with and without one backend
        load = {b: 0 for b in backends}
        moved = needless = 0
        for f in flows:
            a, b = before(f), after(f)
            load[a] += 1
            if a != b:
                moved += 1
                if a != gone: needless += 1           # moved although its backend is still alive
        share = len(flows) / n
        print(f"N={n:<3} {name:<17} load max/min {max(load.values())/share:.3f}/{min(load.values())/share:.3f}  "
f"flows moved {100*moved/len(flows):5.2f}% of which needlessly {100*needless/len(flows):5.2f}%")N=10 modulo load max/min 1.006/0.989 flows moved 90.01% of which needlessly 79.96%
N=10 ring, 100 vnodes load max/min 1.240/0.801 flows moved 8.97% of which needlessly 0.00%
N=10 maglev M=65537 load max/min 1.005/0.996 flows moved 10.28% of which needlessly 0.23%
N=100 modulo load max/min 1.033/0.955 flows moved 99.01% of which needlessly 97.99%
N=100 ring, 100 vnodes load max/min 1.157/0.763 flows moved 0.86% of which needlessly 0.00%
N=100 maglev M=65537 load max/min 1.033/0.966 flows moved 1.62% of which needlessly 0.63%Read the rows by scheme. Modulo balances well (the busiest backend carries 1.03 times its share at 100 backends) and then moves nearly everything: 99% of flows when one of 100 backends leaves, almost all of them needlessly, exactly like the eight connections in the scene. The ring moves only the flows it must, with 0.00% needless, but it balances worse, because where the random points happen to fall decides how big each backend's slice of the circle is. The busiest of 100 backends carries 1.16 times its share here, and if you change the seed in the ring's h(..., 3) call, the busiest backend lands anywhere from about 1.15 to 1.4 times its share. Maglev is nearly as even as modulo and moves only 0.63% of flows needlessly, at 100 backends. The load figures include a little sampling noise, because they're counted over a finite set of flows.
?Why would Maglev accept moving any flows needlessly?
Because uneven load costs money every second, and disruption only costs when the set changes. Its authors say so directly: earlier schemes "prioritize minimal disruption over load balancing", and "Maglev takes the opposite approach". A backend that gets 1.3 times its share, which a ring can do at 100 backends, forces you to overprovision the whole fleet by that much. The few flows Maglev moves needlessly are caught by the connection table on the machine that already has them.
3.5Other L4 designs
Maglev isn't the only way to build this. Each design below makes the same two choices, how to receive packets quickly and how to keep connections through changes, in its own way. Four terms in the table need a sentence each. XDP lets a program run inside the network card's driver on each packet, before the kernel's normal network stack sees it (chapter 48 covers it). DPDK is a library that lets a user-space program read packets straight from the network card. An LRU connection table drops the entry used least recently when it's full. Rendezvous hashing gives every backend a score for each flow and sends the flow to the highest scorer, with the runner-up as a natural backup.
| System | Data plane | Keeping connections through changes |
|---|---|---|
| Maglev (Google, NSDI 2016) | Kernel-bypass user-space forwarder; the paper reports saturating 10 Gbit/s with small packets | Maglev hashing plus a local connection table |
| Katran (Facebook, 2018) | XDP in the kernel driver | "An extended version of the Maglev hash" plus an LRU connection table |
| GLB Director (GitHub, 2018) | DPDK | Rendezvous hashing picks a primary and a secondary; a packet the primary doesn't know gets a "second chance" at the secondary |
| Unimog (Cloudflare, 2020) | XDP on every edge server, no separate tier | "Daisy chaining" from the Beamer paper: a server forwards packets for connections it doesn't own to the previous owner |
Every one of them solves the problem from section 3.3: the set of servers changes all the time, and existing connections must not notice.
All of this spread connections without reading a single request. The only thing an L4 balancer has to go on is the 5-tuple. A balancer that ends the connection itself and reads each request can use much more information, and that's the next layer up.
04Layer 7: choosing a backend per request
An L7 balancer is a proxy: a server that sits between clients and backends, receives requests on the client's behalf and forwards them. It ends the client's connection and sends each request to a backend over its own pool of connections. Now the unit being balanced is a request. And since the proxy sees every request go out and every response come back, it can know how each backend is doing.
4.1The algorithms
The four rules from section 1 return here with their real names, along with a few that need more information. A request is in flight from the moment the proxy sends it to a backend until the answer comes back, and several of these rules count in-flight requests. Peak EWMA uses an EWMA, an exponentially weighted moving average, which is an average that gives recent measurements more weight, so it follows changes. It comes from Finagle, Twitter's library for calls between services, and Linkerd, a service mesh (a proxy placed next to every service) built on the same ideas.
| Algorithm | Picks | Uses | Weakness |
|---|---|---|---|
| Round robin (weighted) | The next backend in turn | Nothing about the backends | Keeps feeding a slow backend its full share |
| Least connections / least request | The backend with the fewest in flight | A counter per backend | Needs a global view; a fast-failing backend looks idle |
| Power of two choices (P2C) | The less loaded of two random backends | The same counter, for two backends | Slightly less exact than least-request |
| Consistent hash (ring, Maglev) | A backend determined by a key (user, session) | The key | Hot keys make hot backends |
| Peak EWMA (Finagle, Linkerd) | Lowest recent latency × load | Latency history | Needs tuning; reacts to noise |
Consistent hash is the table from section 3.4 again, keyed by a user or a session instead of a 5-tuple, so that one user keeps landing on the backend that has their data cached. "Power of two choices" is the "two random choices" rule from the simulation, and its row in the table matches that result: close to least-loaded, with a counter for two servers instead of ten.
?Why pick from two random backends instead of the best one?
Because "the best one" needs a fresh global view, and when many proxies share one stale view, they all pick the same "best" backend at once and overload it. Picking two at random and taking the less loaded avoids the worst choices without a herd. Michael Mitzenmacher's The Power of Two Choices in Randomized Load Balancing shows the second choice cuts the expected maximum load roughly exponentially, from about log n / log log n to log log n / log 2.
Envoy's LEAST_REQUEST does exactly this: its choice_count "Defaults to 2 so that we perform two-choice selection" (least_request.proto). HAProxy's balance random(2) picks "the least loaded of these servers" after two draws.
4.2One slow server, three algorithms
Algorithms only differ when backends differ, so let's go back to our four servers and make one of them sick: s1, s2 and s3 answer in 2 ms, and s4 takes 50 ms (a garbage-collection pause, where the language runtime stops the program to free memory; a noisy neighbour on the same machine; a cold cache). HAProxy sits in front of them, and wrk, an HTTP load generator, plays the shoppers.
Three details of the setup matter. In HAProxy's configuration, balance picks the algorithm, and we try roundrobin, leastconn (least in-flight requests) and random(2) (two random choices). The check on each server line turns on health probes, which section 5 covers. In the wrk command, -t2 -c32 -d10s --latency means two threads, 32 connections, ten seconds, and print the latency percentiles. Percentiles name how slow the slow end is: p50 is the median (half the requests are faster), p90 means 90% are faster, and p99 is as before. The second command asks HAProxy over its admin socket how many requests each server got.
# backend be
#     balance roundrobin | leastconn | random(2)
#     server s1 127.0.0.1:18401 check      # 2 ms
#     server s2 127.0.0.1:18402 check      # 2 ms
#     server s3 127.0.0.1:18403 check      # 2 ms
#     server s4 127.0.0.1:18404 check      # 50 ms
wrk -t2 -c32 -d10s --latency http://127.0.0.1:18400/
echo "show stat" | socat - /tmp/lb34.sock # requests per serverrep1 roundrobin p50=10.38ms p90=50.99ms p99=51.23ms rps=2127.50 s1=5345 s2=5345 s3=5344 s4=5344
rep1 leastconn p50=3.04ms p90=27.08ms p99=50.98ms rps=7981.47 s1=26097 s2=26140 s3=26097 s4=1568
rep1 random(2) p50=3.11ms p90=43.95ms p99=51.10ms rps=4637.40 s1=15961 s2=12366 s3=14489 s4=3768
rep2 roundrobin p50=13.38ms p90=50.98ms p99=51.30ms rps=2124.17 s1=5336 s2=5336 s3=5335 s4=5335
rep2 leastconn p50=3.04ms p90=27.31ms p99=50.97ms rps=8070.82 s1=26417 s2=26419 s3=26393 s4=1569
rep2 random(2) p50=3.13ms p90=43.83ms p99=51.23ms rps=4537.18 s1=15612 s2=12034 s3=14203 s4=3692
rep3 roundrobin p50=16.73ms p90=50.98ms p99=51.29ms rps=2118.80 s1=5318 s2=5318 s3=5317 s4=5317
rep3 leastconn p50=3.15ms p90=33.23ms p99=53.37ms rps=5830.76 s1=18927 s2=18973 s3=19043 s4=1496
rep3 random(2) p50=3.18ms p90=43.30ms p99=53.69ms rps=4183.33 s1=14286 s2=11121 s3=13000 s4=3543Each line is one 10-second run: three repetitions of each algorithm, with rps the requests per second that completed and s1 to s4 the number of requests each server received. Look at round robin's s4 count first. It's almost identical to the other three, because round robin gave the slow server the same share as the fast ones. Here are the medians of the three runs:
| Algorithm | p50 | p90 | p99 | Requests/s | Share to the slow server |
|---|---|---|---|---|---|
| roundrobin | 13.4 ms | 51.0 ms | 51.3 ms | 2,124 | 25% |
| random(2) | 3.1 ms | 43.8 ms | 51.2 ms | 4,537 | 8.1% |
| leastconn | 3.0 ms | 27.3 ms | 51.0 ms | 7,981 | 2.0% |
?Why is round robin's median four times worse, when three servers are fast?
Because wrk is a closed loop: 32 connections, each sending its next request only after the last one returns. Round robin keeps handing the slow server a quarter of the requests, so connections spend most of their time waiting on it, and the whole fleet runs at the slow server's pace. That's also true of any client pool with a fixed concurrency, such as a thread pool calling a service.
Least-connections notices that requests pile up on the slow server and sends it 2% of the traffic. random(2) sits between the two: with four servers, the slow one is in half of all random pairs, and it only loses the comparison when it has more in flight. The uneven s1/s2/s3 counts under random(2) come from HAProxy drawing through a consistent-hash map, which it documents; hash-balance-factor evens it out. And the p99 of every algorithm stays at 51 ms, because the slow server still gets some requests. Only removing it fixes the tail.
Removing a server that is slow or broken needs the balancer to notice, and that's the job of health checks.
05Health checks
Load-aware algorithms steer traffic away from a slow server, but they never take it out. Taking servers out entirely is the job of health checks, the balancer's way of deciding whether a backend should receive traffic at all, and it's where balancers most often get it wrong.
5.1Active and passive checks
There are two ways to find out that a backend is unwell. The balancer can ask it: send a small request to a special address such as /health every few seconds, called a probe. Or it can watch how real requests are going. The first is an active check and the second a passive one, also called outlier detection. A passive check reads the status code that starts every HTTP response: 200 means success, and codes from 500 to 599, written 5xx, mean the server itself failed. A passive check also notices connections that are reset or requests that time out.
| Active health check | Passive (outlier detection) | |
|---|---|---|
| How | The balancer probes GET /health every few seconds | The balancer watches real responses: 5xx, resets, timeouts |
| Sees | Whatever /health checks | What users get |
| Blind spot | Anything /health doesn't exercise | Backends with no traffic yet |
| Examples | ALB/NLB target health, Kubernetes readiness probes, HAProxy check | Envoy outlier detection, HAProxy observe layer7, Linkerd failure accrual |
Look at the "Sees" row. An active check is only as good as the question /health asks, and that question is written by whoever wrote the server. What happens when it asks the wrong one?
5.2The check that says 200
Here is the most common way a check misleads. A server's /health handler returns 200 OK as long as the process is up. But its real pages need a connection to the database, and s4 has lost its connection. Every real request to s4 now gets a 500, the generic server error. Watch what the balancer sees:
Let's reproduce this with HAProxy and the same four-server setup, with s4 answering 500 to real requests and 200 to /health. HAProxy can run both kinds of check. check inter 1s is the active check, one probe per second. observe layer7 adds passive watching of real responses, error-limit 10 says to act after 10 errors, and on-error mark-down says what the action is: mark the server down. We run wrk for ten seconds twice, once with the active check alone and once with observation added. In the output, Non-2xx or 3xx responses is wrk's count of failed requests. The s4 line comes from HAProxy: its status, how its last health check went (L7OK means the probe got a valid HTTP answer), and how many sessions and 5xx responses it handled.
#   server s4 127.0.0.1:18404 check inter 1s                    # first run
#   server s4 127.0.0.1:18404 check inter 1s \
#          observe layer7 error-limit 10 on-error mark-down     # second run
wrk -t2 -c32 -d10s http://127.0.0.1:18400/== server option: '(none)'
78761 requests in 10.01s, 9.18MB read
Non-2xx or 3xx responses: 19691
s4 status=UP check=L7OK sessions=19697 5xx=19697
== server option: 'observe layer7 error-limit 10 on-error mark-down'
76254 requests in 10.00s, 8.51MB read
Non-2xx or 3xx responses: 104
s4 status=DOWN check=HANA sessions=104 5xx=104Without observation, 19,691 of 78,761 requests failed, which is 25%, while s4 reported L7OK the whole time. That's the scene, with round robin handing it a quarter of the traffic. Watching real responses cut the errors to 104, and s4 ended the run DOWN with HANA, HAProxy's code for a server marked down after analysing real responses.
A second run of the observed setup showed chkdown=6, the count of times HAProxy took s4 out of service: it was marked down six times in about 13 seconds. The passing /health check kept bringing it back, and each return cost about ten more errors.
A lying check wastes a quarter of the traffic. Once the balancer is also load-aware, the same lie gets worse.
5.3The black hole
A server that fails fast, because it rejects requests before doing any work, finishes requests sooner than its healthy neighbours. To least-connections, that looks like the least busy server in the fleet.
David Yanacek describes this in the Amazon Builders' Library article Implementing health checks: "some load-balancing algorithms, such as 'least requests,' give more work to the fastest server. When a server fails, it often begins failing requests quickly, creating a 'black hole' in the service fleet by attracting more requests than healthy servers."
Four backends behind HAProxy. s4's database is down, so it answers every request with an immediate 500; the other three take 2 ms to answer correctly. The health check passes on all four. What share of requests does leastconn send to s4?
?So is least-connections a bad idea?
No. It's the right default for slow servers, which are the common case. It needs a partner that counts failures, not just load: outlier detection that ejects a backend on consecutive 5xx. Yanacek also mentions a blunter fix used at Amazon: "slowing down failed requests to match the average latency of successful requests", so a broken server stops looking attractive.
Passive detection fixes the black hole, and a better /health would fix the lying check. The obvious improvement to /health has a danger of its own.
5.4The check that takes everyone out
The obvious fix for a shallow check is a deep one: have /health query the database too. Now s4's lie is gone. But a new failure appears. When the database has a bad minute, every server's deep check fails at once, and a balancer that believes them removes the whole fleet, turning a partial outage into a total one.
So there's a trade-off in how deep a check goes:
| Check depth | Catches | Risk |
|---|---|---|
| Liveness: the process answers | Crashed or hung processes | Misses everything else (section 5.2) |
| Local health: disk writable, config loaded, workers alive | Problems on this one server | Misses broken dependencies |
| Dependency health: can reach the database, caches, downstreams | Server-specific connectivity failures | A shared dependency failing fails every server's check together |
Balancers defend against the last row by refusing to believe that everything is broken:
| Balancer | Behaviour when too many backends look unhealthy |
|---|---|
| AWS NLB, ALB | Fail open: "when all servers fail health checks at the same time, the load balancer fails open, allowing traffic to all servers" (Yanacek; for ALB see target health checks) |
| Envoy | Panic mode: below 50% healthy by default, it balances across all hosts, healthy or not (cluster.proto) |
| Envoy outlier detection | Never ejects more than 10% of a cluster by default (max_ejection_percent) |
Envoy's outlier-detection defaults, all from outlier_detection.proto at v1.31.0, show what a reasonable passive check looks like:
| Setting | Default | Meaning |
|---|---|---|
consecutive_5xx | 5 | Consecutive errors before ejection |
interval | 10 s | How often ejections are analysed |
base_ejection_time | 30 s | Ejection length, multiplied by the number of times ejected |
max_ejection_percent | 10% | Ceiling on how much of the cluster can be ejected |
Health checks decide when a server leaves because it's broken. But servers also leave on purpose, and that happens far more often.
06Draining: removing a server without dropping requests
Allowing change was the third job. A deploy replaces every server at least once, so how you remove one decides whether deploys are invisible to shoppers.
6.1What draining means
Draining a backend means three steps: stop sending it new work, let the work already in flight finish, and only then stop it. It sounds simple. It's hard because "stop sending it new work" has to reach every balancer, proxy and client-side connection pool that knows about the backend, and they don't all find out at the same moment.
| Layer | How it drains | Default wait |
|---|---|---|
| AWS ALB / NLB target groups | Target goes to draining; no new requests or connections | deregistration_delay.timeout_seconds: 300 s (docs) |
| HAProxy | set server be/s1 state drain on the runtime API | Until connections close |
| Kubernetes | Pod marked Terminating; endpoint marked not ready | terminationGracePeriodSeconds: 30 s |
| Your process | Stop accepting, finish requests, close keep-alive connections | Whatever you code |
The Kubernetes row is where the "they don't all find out at once" problem is easiest to see.
6.2The Kubernetes race
When a pod is deleted, two things start. The kubelet, the agent on each machine that starts and stops pods, begins shutting the pod down by sending it SIGTERM, a signal that asks a process to finish up and exit. (A process may catch SIGTERM and clean up first. SIGKILL, which the kubelet sends if the process outlives its grace period, can't be caught.) At the same time, the control plane (the Kubernetes components that keep the record of what should be running, led by the API server) begins removing the pod from the Service's EndpointSlices, the lists of pod addresses that proxies read to know where to send traffic. The pod lifecycle docs are explicit that these happen "at the same time".
The proxies that read those lists are kube-proxy on every node, ingress controllers (the L7 proxies that bring outside traffic into the cluster) and service-mesh sidecars (a proxy running next to each pod). Each one learns about the change in its own time. One more piece appears in the sequence below: a preStop hook, a command Kubernetes runs inside the pod before it sends SIGTERM.
Because the preStop hook runs before SIGTERM, it's the natural place for the delay: the pod keeps serving while the hook sleeps, and the proxies catch up in the meantime.
6.3Keep-alive connections don't drain themselves
Suppose the proxy in front has marked our pod as draining and stopped sending it new requests. Requests can still arrive on connections that already exist. HTTP keep-alive lets a client reuse one connection for many requests instead of opening a new one each time, so clients that talk to your server directly, or proxies holding a pool of keep-alive connections to it, will keep reusing the connections they already have.
?How does a server tell a keep-alive client to go away?
By saying so in the protocol, on the next response. HTTP/1.1 has Connection: close: send it on each response while draining, and the client opens its next request on a new connection, which the balancer sends elsewhere. HTTP/2 carries each request on its own numbered stream within the connection, and it and gRPC have GOAWAY, which tells the client the highest stream number the server will process and that it should open new streams on a new connection. Most servers probably send it on graceful shutdown, but check that yours does.
Draining empties a server. The other half of a deploy fills the new one.
6.4Filling: the other half of a deploy
A freshly started server is probably slower than its neighbours for a while: its caches are cold, its JIT (the part of a language runtime that compiles hot code as the program runs) hasn't compiled the hot paths yet, and its connection pools are still empty. A least-connections balancer sees it idle and sends it a flood.
Slow start ramps a new backend's share up over time. In HAProxy, slowstart makes the weight grow "linearly from 0 to 100%" over the given time (configuration manual). ALB target groups and Envoy have equivalents.
Between them, draining and slow start make a rolling deploy invisible: each server leaves quietly and returns gently. What's left is to run all of this and notice when one piece stops working.
07Running it
7.1What to watch
Each failure in this chapter leaves a trace in a particular number. The table says which, so a dashboard can catch it before shoppers do.
| Signal | Why it matters |
|---|---|
| Per-backend request rate and error rate | A black hole shows as one backend with a high share and a high error rate |
| Per-backend latency, not just the aggregate | The fleet p99 hides which server is slow |
| Health-check state changes per minute | Flapping means an active and a passive check disagree |
5xx generated by the balancer itself (ALB HTTPCode_ELB_5XX_Count, Envoy upstream_cx_none_healthy) | Distinguishes "no healthy backend" from "the backend errored" |
| Errors during deploys | Non-zero means draining is broken somewhere |
With HAProxy, two commands on the runtime socket answer most of the questions in the chapter:
# Which backend is getting the traffic, and the errors? (sections 4.2 and 5.3)
echo "show stat" | socat - /tmp/lb34.sock       # per-server sessions, 5xx and check status

# Take a backend out of rotation without dropping requests (section 6.1)
echo "set server be/s1 state drain" | socat - /tmp/lb34.sock7.2Rules that hold up
- Make a load-aware algorithm the default. Least-request or power of two choices handles a slow backend; round robin feeds it a full share (section 4.2).
- Match the balancer to the traffic's unit. Multiplexed connections need L7 or client-side balancing (section 2.2).
- Pair load-aware balancing with outlier detection, so a fast-failing backend can't become a black hole (section 5.3).
- Keep
/healthabout this server. Check its own pool, disk and config, and leave a shared dependency's outage to the balancer's fail-open or panic threshold (section 5.4). - Never let a passive and an active check fight. Fix
/health, or eject with backoff (section 5.2). - Keep serving after SIGTERM, then drain, then close keep-alive connections, all inside the grace period (section 6.2).
- Slow-start new backends that run least-connections balancing (section 6.4).
7.3What you trade for what
| You get | You pay | When the bill arrives |
|---|---|---|
| L4 balancing: a hash and a table lookup per packet | The balancer can't see requests or retry them | As one hot backend when connections are long-lived and multiplexed |
| L7 balancing: per-request choice, retries, routing | Parsing, and usually decrypting, every request | As CPU on the proxy tier |
| Maglev's table: even load, few flows moved | A small number of flows move needlessly | As resets that the connection table mostly absorbs |
| Least-request balancing: steers around slow servers | Fast failures look attractive | As a black hole, unless outlier detection is in place |
| Deep health checks: catch real breakage | A shared dependency failing fails every check at once | As a whole fleet removed in a database blip |
| Draining: invisible deploys | Slower deploys, and a shutdown sequence to maintain | As errors on every deploy if it's wrong |
7.4Symptom, cause, fix
| Symptom | Likely cause | Fix |
|---|---|---|
| p50 fine, p90/p99 bad, one backend slow | Round robin feeding a degraded backend | Least-request or P2C; per-backend latency alerts |
| Error rate exactly 1/N, all health checks green | Shallow health check on a broken server | Check what the server needs; add outlier detection |
| One backend has far more traffic and far more errors | Black hole: least-request attracted to fast failures | Outlier ejection on 5xx; slow down failures |
| All backends removed during a database blip | Deep dependency health checks | Local-only checks; rely on fail-open or panic threshold |
| A backend bounces in and out every few seconds | Passive ejection and active check disagree | Fix /health, or ejection with backoff |
| Errors on every deploy | Process exits on SIGTERM before endpoints update | preStop sleep, graceful drain, Connection: close or GOAWAY |
| One pod hot, others idle, with gRPC | L4 balancing of multiplexed connections | L7 balancing or client-side balancing |
| Connections reset when an L4 balancer scales | ECMP set change without consistent hashing | Maglev-style hashing plus connection tracking |
| A new instance overloaded right after it starts | Least-connections sending a cold server a burst | Slow start |
08Summary
- How a load balancer picks matters. With the same ten servers and the same traffic, picking the least-loaded one gave a p99 of 4.93 ms against 23.85 ms for picking at random.
- One decision carries three jobs: spread load, hide failures and allow change, and they pull against each other.
- L4 balances connections and L7 balances requests. Multiplexed protocols like gRPC need L7 or client-side balancing.
- ECMP lets a router spread a VIP across a fleet of balancers, by hashing the 5-tuple, as long as the fleet doesn't change.
hash % Nmoves nearly every connection when N changes. Removing one of 100 backends moved 99% of flows with modulo and 1.6% with Maglev.- Maglev's table keeps flows in place: backends take turns claiming slots from their own preference lists, which gives even load and few moves, and the connection table absorbs the few that move needlessly.
- Power of two choices gets most of the benefit without a herd, which is why it's Envoy's default for least-request.
- Load-aware algorithms matter when one server is sick. With one 25× slower backend, leastconn cut p50 from 13.4 to 3.0 ms and gave it 2% of traffic.
- A shallow health check hides a broken server, and a deep one can take out the fleet. Check what's local, and let fail-open handle the rest.
- Least-connections turns fast failures into a black hole. It sent about half of all traffic to a server answering instant 500s.
- Draining is a race between shutdown and routing updates. Keep serving after SIGTERM, then close keep-alive connections deliberately.
09Build this
A load balancer you can break.
- Write a small L7 proxy in the language you use at work, with round robin, least-request and P2C, and per-backend counters for in-flight requests, errors and latency.
- Put four backends behind it with injectable faults: extra latency, instant 500s, and a
/healththat lies. Reproduce section 4.2's table and section 5.3's black hole. - Add outlier detection with an ejection time that doubles on each ejection, and a cap on how much of the fleet can be ejected. Show that it stops the black hole without flapping, and that a failure on all four backends doesn't eject them all.
- Add draining: an admin endpoint that stops new requests to a backend and sends
Connection: closeon its responses. Run a rolling restart under load and get the error count to zero.
10Interview questions
beginnerWhat's the difference between an L4 and an L7 load balancer?›
L4 works on connections: it sees IPs and ports, picks a backend when a flow starts, and forwards packets without parsing them. It's cheap and protocol-agnostic. L7 terminates the connection and parses the application protocol, usually HTTP, so it can balance per request, route on path or headers, retry, and terminate TLS, at a much higher cost per unit of work.
beginnerWhat does connection draining do?›
It stops sending new work to a backend while letting in-flight work finish,
before the backend is stopped. On AWS target groups the default deregistration
delay is 300 seconds. On Kubernetes, draining has to cover the gap between
SIGTERM and every proxy removing the endpoint, usually with a preStop sleep
and graceful shutdown in the server.
intermediateWhy is round robin a poor default?›
It ignores backend state, so a degraded backend keeps receiving its full share. Any client with bounded concurrency then spends most of its time waiting on that backend. In the experiment in section 4.2, one backend of four answering 25 times slower took round robin's p50 to 13.4 ms against 3.0 ms for least-connections, which sent it 2% of traffic. Least-request or power of two choices are better defaults.
intermediateExplain the power of two choices.›
Pick two backends at random and send the request to the one with fewer requests in flight. It avoids the worst backends without every balancer herding onto the same "best" one from a stale view. Mitzenmacher showed the second choice reduces the maximum load exponentially compared with a single random choice. Envoy's least-request uses two choices by default.
intermediateA service has a 25% error rate and all four backends pass health checks. What's going on?›
Probably one backend is broken in a way /health doesn't test, such as a lost
database connection, and round robin keeps giving it a quarter of the traffic.
Look at per-backend error rates. Fix the health check to cover what that server
needs, and add passive outlier detection on 5xx so the balancer reacts to what
users see.
deepHow does Maglev hashing work, and why is it preferred over a hash ring for L4 balancing?›
Each backend gets a permutation of the slots of a prime-sized table, derived from an offset and a skip hashed from its name. Backends take turns claiming their next free preferred slot until the table is full, so each gets ⌊M/N⌋ or ⌈M/N⌉ slots. Lookup is one hash and one array read. A ring with virtual nodes moves fewer flows on changes but balances unevenly: in the experiment in section 3.4, the ring's busiest of 100 backends carried between about 1.15 and 1.4 times its share depending on the hash seed, against 1.03 for Maglev. Maglev covers its extra disruption with a connection-tracking table.
deepWhat's a load-balancing black hole?›
A backend that fails fast, returning errors without doing work, looks idle to a least-connections or least-request balancer, so it attracts more traffic than healthy backends. In the section 5.3 experiment, leastconn sent about half of all requests to the failing one of four servers. Defences are outlier ejection on consecutive errors, slowing failures down to normal latency, and alerting on per-backend share combined with error rate.
deepShould a health check test the database?›
Test this server's ability to use it, not the database's health. If every server's check fails when the shared database blips, the balancer removes the whole fleet and a partial outage becomes total. Check local things (own pool, disk, config, worker threads), and rely on the balancer's fail-open or panic threshold, such as NLB failing open or Envoy's 50% panic threshold, for failures that hit every server at once.
11Go deeper
Removing one of 100 backends with hash % N moves how many flows?›
About 99% in the experiment. Every flow whose hash modulo 100 differs from its hash modulo 99 moves, which is nearly all of them.
Why is Maglev's table size prime?›
So that any skip between 1 and M − 1 generates a permutation that visits every slot exactly once.
Envoy is ejecting hosts for 5xx. How much of a cluster can it eject by default?›
10%, set by max_ejection_percent. Below 50% healthy, the panic threshold makes it balance across all hosts anyway.
A pod exits within 50 ms of SIGTERM. Why do some requests fail?›
Endpoint removal happens in parallel with SIGTERM, so proxies and nodes keep routing to the pod until they catch up. Keep serving for a few seconds first.
ECMP, GRE, direct server return, connection tracking and the hashing scheme, with production measurements. USENIX.
The analysis behind P2C, and why a second random choice is worth so much more than a third. PDF.
Liveness, local and dependency checks, fail open, black holes and outlier detection, from operating Amazon's fleets. aws.amazon.com.
The Maglev table build and every outlier-detection knob, with defaults. v1.31.0.
L4 balancing with no separate tier, in XDP on every server, and daisy chaining to survive changes. blog.cloudflare.com.
Rendezvous hashing with a primary and a secondary per bucket, and the "second chance" that lets proxies drain. github.blog.
Interactive simulations of balancing algorithms that you can watch queue up, a visual companion to section 1 and section 4. samwho.dev.
12Related chapters
The accept queue, SYN retries and XDP underneath every load balancer and backend in this chapter. Chapter 10.
Why one slow server dominates the tail, and the queueing behind section 4.2's numbers. Chapter 16.
Where NLBs and ALBs sit in a VPC, and the cross-AZ bill for balancing across zones. Chapter 33.
The XDP programs that Katran and Unimog are built on. Chapter 48.