You're building a linked list in C. Every time the program adds an item, it calls malloc(40), which asks for 40 bytes of memory and returns the address of a fresh piece that nothing else is using. When the program is done with the item, it calls free on that address to hand the piece back. A million items later, you'd expect that after freeing all of them the program's memory use would fall back to where it started.
It doesn't. A program can free every piece it ever asked for and still sit on hundreds of megabytes, and nothing is broken. The reason is that malloc and free never talk to the operating system the way you'd imagine. A piece you free is not returned to anyone; it's kept somewhere, waiting for the next malloc.
The somewhere is the allocator, the code behind malloc and free that every language runtime carries with it. This chapter asks one question and follows it all the way down: when I call malloc(40) and later free the piece, where does that memory come from, where does it go, and why doesn't it go back to the system? We'll watch the effect first, then build an allocator one problem at a time until it looks like the real ones, and finish with what each design choice costs and how to see it on a running program.
01Free everything and keep it all
1.1Half a gigabyte, freed
Let's make the effect visible. The program below plays the part of the list-builder, with 1 KB nodes instead of 40-byte ones so the effect is big enough to see. It allocates half a million nodes, frees nine out of every ten, then frees the rest, and after each step it asks the operating system how much memory the process is using.
That number needs a little background. The kernel, the core of the operating system that owns the hardware, gives memory to a program in fixed-size chunks called pages: 4 KB on most Linux machines and 16 KB on Apple Silicon Macs. A process is one running program, and the kernel keeps count of how many of a process's pages are sitting in RAM right now. That count is the process's resident set size, or RSS, and the ps command prints it in kilobytes. A fresh page only counts once the program has written something into it, which is why the program stores one byte into every node it allocates.
The helper rss_mb runs ps -o rss= -p <our own process id> (the = after rss removes the column heading) and divides the kilobytes by 1,024 to get megabytes.
The program allocates 500,000 blocks of 1 KB (about half a gigabyte), frees 90% of them, and then frees the rest. After the very last free, roughly what does the process's RSS show?
#include <stdio.h>
#include <stdlib.h>
#include <unistd.h>

static double rss_mb(void) {
    char cmd[64]; snprintf(cmd, sizeof cmd, "ps -o rss= -p %d", getpid());
    FILE *f = popen(cmd, "r"); long kb = 0; fscanf(f, "%ld", &kb); pclose(f);
    return kb / 1024.0;
}

int main(void) {
    enum { N = 500000, SZ = 1024 };
    static char *p[N];
    printf("start                    : %6.1f MB\n", rss_mb());
    for (int i = 0; i < N; i++) { p[i] = malloc(SZ); p[i][0] = 1; }
    printf("after 500,000 x 1 KB     : %6.1f MB\n", rss_mb());
    for (int i = 0; i < N; i++) if (i % 10) { free(p[i]); p[i] = NULL; }
    printf("after freeing 90%%        : %6.1f MB\n", rss_mb());
    for (int i = 0; i < N; i++) if (p[i]) { free(p[i]); p[i] = NULL; }
    printf("after freeing the rest   : %6.1f MB\n", rss_mb());
}start : 1.3 MB
after 500,000 x 1 KB : 495.4 MB
after freeing 90% : 495.4 MB
after freeing the rest : 495.7 MBRead the four lines in order. The process starts at 1.3 MB. Half a million 1 KB nodes bring it to 495.4 MB, which is about what 500,000 kilobytes should add up to. Freeing 90% of the nodes changes nothing at all. Freeing the rest changes nothing either: with every node freed, the process still holds 495.7 MB, slightly more than before. On macOS, the allocator (libmalloc) kept the pages.
1.2Why that isn't a leak
A leak is memory your program has lost track of: it still owns the piece but no pointer to it exists, so nobody can ever free it. A leaking program grows for as long as it runs. Here the program freed everything, and the code holding the 495 MB knows exactly where every piece is, because it keeps them for the next malloc.
That code is the allocator. The kernel only sees the pages it handed out, and as far as it can tell the process is still using every one of them, so RSS stays where it peaked. Which allocator you run, how it groups sizes, and how eagerly it hands pages back all change what you see in this experiment.
To see why a layer like this exists at all, and why it behaves this way, we should start with what the kernel is willing to sell.
02Why programs need an allocator
2.1Pages are the wrong size
The kernel sells memory by the page, 4 KB or 16 KB at a time, through system calls such as mmap. A system call, or syscall, is a request from your program to the kernel: the CPU stops running your code, switches into the kernel, does the work, and switches back. mmap is the one that asks for fresh pages.
Your program doesn't think in pages. It asks for a 40-byte node, a 100-byte string, a 3 KB buffer, millions of times a second. So why not call mmap for each of them?
?Why not ask the kernel for every object?
Because both costs are absurd. Each request would be a syscall, and the crossing alone costs about 350 nanoseconds (chapter 07 times it), which is far more than the work of handing out 40 bytes. And each 40-byte node would occupy a whole page, so a million nodes would take a million pages: 4 GB on a 4 KB-page machine, 16 GB with 16 KB pages, for 40 MB of data.
The fix is a middleman. Think of a car park attendant who buys whole floors from the building's owner and hands out single spaces to drivers. When a car leaves, the attendant marks the space free for the next driver and keeps the floor, because buying and returning floors is slow and the next car is probably minutes away. The allocator is that attendant: it asks the kernel for big chunks of memory, cuts them into the pieces your program asks for, and keeps the freed pieces on hand. Its pool of memory is called its heap.
2.2What malloc promises
Before building one, we should write down the contract. malloc(n) promises a pointer to n usable bytes that no other live allocation overlaps. The pointer is also aligned, meaning its address is a multiple of some number (16 on most 64-bit systems). Alignment matters because some CPU instructions run slower, or refuse to run, on values that straddle such a boundary, and malloc doesn't know what you'll store in the piece, so it lines every piece up for the strictest case. free(p) promises that the piece at p becomes available again.
That's the entire contract. It says nothing about how fast malloc is, where the piece will be, or whether freed memory ever leaves the process. An allocator is free to choose any of those, and a surprising number of production incidents come from the choices. Those gaps are the room we have to design in, so let's start with the simplest allocator that keeps the contract.
03Building an allocator, one problem at a time
Each version below fixes the one before it, and each fix creates a new problem. Real allocators are the sum of all four. We'll watch them hand out memory from a single fresh page.
3.1The bump allocator
The simplest allocator takes one big chunk and keeps a pointer to the first unused byte. To allocate n bytes, it returns the pointer and moves it forward by n. That's a bump allocator, and it's close to the fastest allocator possible: a couple of instructions per call.
?Why can't a bump allocator free?
Because the pointer only moves forward. Once it has passed a node, nothing records that the node's bytes are available again. The memory stays used until the whole chunk is thrown away, so a program that allocates and frees in a loop would eat through the chunk and then run out.
3.2Free lists, and fragmentation
So the next step is to remember freed pieces. When a program frees a piece, the allocator links it into a free list, a list of pieces that are ready for reuse, and malloc checks that list before it bumps the pointer. Here is one page, first with the bump pointer alone and then with a free list added:
Now memory gets reused, and a new problem appears, as frames 6 and 7 hint. Free a 40-byte node and then ask for 100 bytes, and the 40-byte hole is no use. Do that for a few hours with mixed sizes and the heap can end up full of free pieces that are each too small for what's being asked. That waste is fragmentation: plenty of free memory in total, none of it in a usable shape.
3.3Size classes
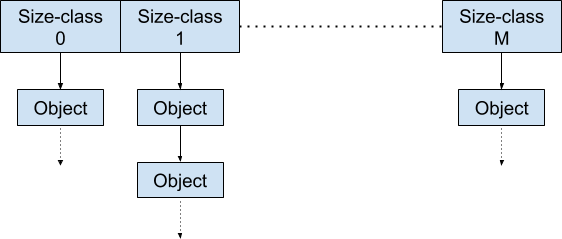
Real allocators avoid most of that with size classes. Every request is rounded up to one of a fixed set of sizes (say 8, 16, 32, 48, 64 bytes, then coarser steps above that), and each class keeps its own free list. A request for 40 bytes gets a 48-byte block.
Any freed 48-byte block now fits the next 48-byte request exactly, so the hole problem from 3.2 mostly disappears. And "find a block that fits" turns into an array index: the allocator computes the class number and looks at that class's list.
?What does rounding cost?
Memory. With classes of 16 and 32, a 17-byte request gets a 32-byte block, and nearly half of it is wasted. That sounds bad, but it's usually cheaper than the fragmentation it prevents. It also buys speed: allocation becomes a pop from a list and freeing becomes a push, with no searching.
3.4Threads, caches and arenas
So far there has been one program doing one thing at a time. A real server runs many threads, separate lines of execution inside one process that can run on different CPU cores at the same moment, and every one of them calls malloc.
If all threads share one free list per size class, two of them could pop the same block at the same instant, so the list needs a lock: a guard that lets one thread in at a time while the others wait. On a busy server the waiting is the cost (chapter 13 measures what lock contention costs).
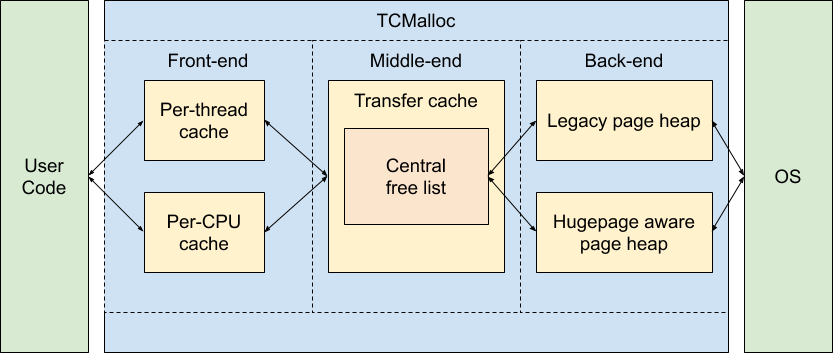
So every modern allocator, including tcmalloc, jemalloc, mimalloc, macOS's libmalloc and glibc's malloc, gives each thread a thread cache: a small private stock of free blocks for each size class, touched only by that thread. (macOS's libmalloc keeps one stock per CPU core instead of per thread, which solves the same problem the same way.) Taking a block from it needs no lock and none of the slower atomic operations, the special CPU instructions threads use to coordinate. Only when the cache is empty does the thread go to the shared central heap behind it, and it takes a whole batch of blocks in one trip, so one lock acquisition pays for many later allocations. When the cache grows too big, the thread returns a batch.
Some allocators go one step further and run several arenas: independent heaps, each with its own central lists and lock, so threads spread across them instead of queuing at one. (Section 7 uses the word arena for a different idea, so keep this meaning in mind: several heaps, side by side.)
| Design | Fast path | What it costs |
|---|---|---|
| One global free list | A lock on every call | Contention on a busy server |
| Per-thread cache | A list pop, no atomics | Blocks freed on one thread aren't available to others until a flush |
| Several arenas | Threads spread over independent heaps | Freed memory can sit in one arena where the others can't reuse it |
Every row of the table buys speed by letting memory sit where one thread can't share it, and we'll see that bill come due in section 4.2. For now we have all the pieces: size classes, thread caches, a central heap behind them, and the kernel behind that. Let's follow one malloc(40) through all of it.
04One malloc call, step by step
4.1Fast path, then slow path
With size classes and thread caches in place, most calls finish in a few nanoseconds, and a few fall through to slower paths. To watch both, suppose a thread has never asked for a 48-byte block, and follow its first malloc(40) and then its second. One new word first: a span is a run of pages the allocator has set aside to cut into blocks of one size.
malloc(40). The allocator rounds 40 up to the 48-byte class, a quick calculation with nothing to search, and looks in this thread's cache for a free 48-byte block. There is none: this thread has never needed one.Notice the shape of the cost. The first call took every slow step, a lock and a syscall among them, and bought a whole batch of blocks. The calls after it took only the fast path, which never enters the kernel and never takes a lock. The nine or so nanoseconds per call that section 7.1 lists are almost entirely that fast path: a size-class computation, a list pop and some bookkeeping.
free follows the same route in reverse, and it's quick when the block goes back to the cache it came from. That's not always where it ends up.
4.2Freeing on another thread
The thread that frees a block isn't always the one that allocated it. A common pattern in servers is a producer thread that allocates objects and hands them to a consumer thread through a queue, and the consumer is the one that frees them. Where do the blocks go? In most allocators free puts a block in the cache of the thread that calls it, wherever the block was allocated, and that turns out to be expensive for the producer. Here are three 48-byte blocks in the producer's cache, and two spares waiting in the central heap:
malloc for this size.The producer pays a refill, with its lock, on every round, and in some allocators (mimalloc is one) the consumer's free is slower too, because a block that belongs to another thread has to be sent back to its owner with an atomic operation. Meanwhile memory piles up. This is how a long-running service's memory can climb with no leak. Freed memory sits in one thread's cache or one arena, where the other threads can't reuse it and the kernel never gets it back. MALLOC_ARENA_MAX, a setting that caps how many arenas glibc creates, exists because of this. So do the replacement allocators that people switch to: jemalloc, which Redis ships as its default on Linux, and Google's tcmalloc.
Everything so far has been about small blocks. A request for something big is handled differently.
4.3Why big allocations behave differently
Past a threshold (128 KB in glibc by default), allocators stop carving from their own heap and call mmap for that one block directly. When the block is freed, munmap returns it to the kernel. glibc also raises the threshold by itself after you free a big block, so the exact point moves, but the idea stays: big blocks bypass the size classes and the caches.
On a fast laptop, malloc + free of 256 bytes costs about 9.5 ns. Roughly what does 64 KB cost?
That is one allocator's behaviour in a loop that allocates and frees a single size. A program that keeps asking for fresh big buffers can pay much more. Each allocation can be an mmap syscall and each free a munmap, the syscall that hands pages back. Then there are the pages themselves. Section 1.1 noted that a fresh page only counts once something is written into it, and that's because the kernel supplies the real memory at the moment of that first write. The CPU stops your program, the kernel finds and zeroes a page, and your program carries on. That interruption is a page fault, and a page fault on a first touch costs about 686 ns (chapter 04 measures it), once for every page of every new block. Such a loop can spend most of its time in the kernel, and the fix is to allocate one buffer and reuse it.
So far we've been looking at how fast the allocator hands memory out. The other half of the story is the memory it keeps, and that explains the 495 MB from the start of the chapter.
05Why RSS never comes down
5.1One survivor pins a page
The allocator gets memory from the kernel in pages and hands it out in small blocks. Giving it back only works in whole pages, because the kernel sells and takes back nothing smaller. So an allocator can return a page only if every block on it is free. Here is a burst of 1 KB nodes like the ones in the opening program, drawn on a toy heap with 4 KB pages, four nodes to a page:
Now scale that up to the opening program. It allocated 1 KB nodes one after another, so consecutive nodes sit 1,024 bytes apart, and with 16 KB pages, as on Apple Silicon, that's 16 nodes to a page. It kept every tenth node alive, and any run of 16 consecutive nodes contains one of those survivors, so every page was pinned and none of the 495 MB could go back. After the final frees, every page was entirely free and could have gone back, but libmalloc kept them anyway. Returning memory costs a syscall, and the program will probably ask for memory again soon, so allocators keep a stock of free pages and give them back lazily, if at all.
That's how a process reaches 4 GB of RSS with 400 MB of live data and stays there. There's no leak and no allocator bug, and no statistic inside your application shows it. The usual signature is memory that climbs during a burst of traffic and never recovers.
?What can you do about it?
Three things, in rough order of practicality. Put the burst's objects in their own arena and drop it whole when the burst ends (section 7.2 builds one). Call malloc_trim if your allocator has it: that's glibc's call that asks the allocator to hand back whatever pages it can. Or restart the process, which is less embarrassing than it sounds and is what many systems do.
5.2What malloc doesn't promise
We've now met enough of the machinery to read the list of things malloc leaves out of its contract. Nearly every row is something we've already watched happen.
| Not promised | What that means in practice | Where we saw it |
|---|---|---|
| A time bound | A single malloc may take a lock, split a block, walk a free list, or ask the kernel for memory and take microseconds | Section 4.1, and realloc in 6.2 |
| Return to the OS | Freed memory usually stays in the allocator's pools. Your RSS doesn't go down, and that isn't a leak | Sections 1 and 5.1 |
| Locality | Two sequential allocations may land anywhere. Chapter 02 explains why that matters more than the allocation cost | Not yet: section 6.1 |
| A bound on fragmentation | Peak RSS can exceed peak live bytes by a lot, permanently | Sections 3.2 and 5.1 |
Two rows still have a trap waiting in them. Nothing so far has asked where a block lands in memory, which is the locality row, and the time bound has a second, quieter way to bite besides the slow first call. The next section takes them in turn.
06Two more traps
6.1Allocator-induced false sharing
A CPU doesn't fetch memory a byte at a time. It moves it in cache lines, chunks of 64 bytes on most x86 machines and 128 bytes on Apple Silicon (chapter 02 explains why). When one core writes to a line, every other core's copy of that line is thrown away, so if two cores keep writing to the same line they pass it back and forth, and each write waits. Two threads that write to different variables sitting in the same line pay this price without sharing anything, and that is called false sharing.
The allocator can cause it without your noticing. malloc promises nothing about where blocks land, so two threads that allocate small nodes at the same moment can receive neighbouring addresses, inside one cache line. Neither thread shares data with the other, and they pay chapter 13's penalty anyway: that chapter measures a slowdown of about 55× at eight threads.
Per-thread caches prevent most of this, because each thread carves its blocks from its own span, so two threads' blocks rarely sit side by side. It can still happen where one thread's span ends and another's begins, and with allocators that don't have thread caches. If you're padding a struct for concurrency, pad the allocation, not just the struct.
6.2Realloc in a loop
The time bound hides another trap. realloc resizes a block you already have, and it may extend the block in place if there's free room next to it, or it may allocate a bigger block and copy everything across. You can't tell which from the call.
Suppose you grow a buffer by a fixed 1 KB each time round a loop, up to 1 MB. In the worst case every step copies the whole buffer so far: 1 KB, then 2 KB, then 3 KB, up to 1,024 KB. Those add up to about 525,000 KB, half a gigabyte of copying to build a 1 MB buffer. The source looks perfectly reasonable, and the copying grows with the square of the final size: double the target and you copy four times as much. Programmers write that growth as O(n²), "order n squared".
Grow by a constant factor instead and the copying collapses. Doubling from 1 KB, the copies are 1 KB, 2 KB, 4 KB, and so on up to 512 KB, about 1 MB in total, a single extra buffer's worth. That's what std::vector does when it doubles, and it's why appending to one is amortised O(1), a constant cost per append on average: the occasional expensive copy is spread over the many cheap appends that came before it.
That's the cost of surprises. The next question is how much the ordinary path costs when nothing goes wrong, and whether we can skip it.
07What allocation costs
7.1malloc by size
Here is what malloc followed by free costs for different sizes on a fast laptop. Each figure is an average over two million allocate-and-free pairs after a warm-up. Every block is freed immediately, so it comes straight back from the thread cache, which makes these best-case numbers. A real workload holding thousands of live objects will do worse.
| Size | malloc + free | What's happening |
|---|---|---|
| 16 B | 8.5 ns | Thread cache pop and push |
| 64 B | 9.8 ns | Same path |
| 256 B | 9.5 ns | Same path; size barely matters here |
| 4 KB | 15.1 ns | Larger class, more bookkeeping |
| 64 KB | 73.4 ns | Big-block path, more work per call |
The time is flat from 16 to 256 bytes and then climbs. Under a few hundred bytes the time goes into the mechanism we followed in section 4.1 (the class lookup, the list pop, the bookkeeping), and the size of the block hardly matters. So if you want allocation to be cheaper, shrinking your objects won't help much. Skipping the mechanism would, and the next subsection shows how far that goes.
7.2What you save by knowing the answer in advance
Go back to the bump allocator from 3.1. Its flaw was that it can't free anything. For one situation that flaw doesn't matter: a batch of objects that all die at the same moment. Then there's nothing to free individually, and you drop the whole chunk at once. An allocator used this way is called an arena (or a region). It's the same word as the arenas of 3.4 but a different idea: a block of memory filled from the front and thrown away in one go. It has no free list, no size classes, no thread cache and no individual free, and a call does one thing: return the current pointer and advance it.
?Where does a 42× gap come from?
It's the price of generality. malloc doesn't know that your objects are all the same size, or that you'll free them together, or that no other thread will touch them, so it has to be ready for every case. When you do know, an arena turns allocation into a pointer increment. Here's what that is worth for a parser that builds a tree of 50,000 nodes for each document:
| Allocations per request | parse tree nodes for one document | 50,000 |
| With malloc | 50,000 × 8.5 ns | 425 µs |
| With an arena | 50,000 × 0.2 ns | 10 µs |
| Plus one arena reset | a pointer store | ~0 ns |
| saved per request, before any other optimisation | ≈ 415 µs | |
Request-scoped arenas are common in parsers, compilers and web servers for this reason. Many small objects that all die at the same moment is exactly the pattern general allocators handle worst. A web server that frees every allocation at the end of a request doesn't need a free list at all, which is roughly why nginx gives each request its own pool.
That leaves a practical question: how do you tell which of these problems a real program has, and which fix to reach for?
08Choosing an allocator
8.1Seeing what the allocator is doing
Each question the chapter raised has a tool that answers it on a running program. perf is Linux's profiler, and on macOS leaks and heap list the allocations a process is holding.
# Which allocator, and is it the bottleneck? (section 7)
perf record -g ./app && perf report | grep -iE 'malloc|free|arena'

# jemalloc's own statistics, if you link it (sections 3.4 and 5.1)
MALLOC_CONF=stats_print:true ./app

# glibc: call malloc_stats() from inside the program; it prints each arena's
# bytes from the kernel and bytes in use to stderr (sections 3.4 and 5.1)

# macOS: list leaked blocks when the program exits, with allocation stacks
MallocStackLogging=1 leaks --atExit -- ./app
heap $PID | head -40          # what a running process holds, by size and type

# Fragmentation, roughly: RSS against the sum of live allocations (section 5.1)
The last line is the one that settles most arguments. Compare the process's RSS with the total of the bytes your program has allocated and not yet freed. If RSS keeps climbing along with the live total, that's a leak. If RSS sits far above it and holds steady, that's fragmentation, and no search for a missing free will find it.
8.2The three options
When the profile does point at the allocator, there are three ways out, and they differ in what they cost you.
Modern system allocators are good. Starting anywhere else is premature, and the measurement in 7.1 shows that under a few hundred bytes the cost is single-digit nanoseconds.
- where it breaks
- Multi-threaded allocation-heavy workloads, where glibc's arena handling can fall measurably behind.
- reach for it when
- Almost everything. Change only when a profile names malloc.
Better arena management, better fragmentation behaviour over long uptimes, and far better introspection. LD_PRELOAD is a setting that makes the program loader pick your library's malloc before the system's (chapter 46). Some server workloads see a double-digit percentage win from the swap alone, with no code change.
- where it breaks
- One more dependency, and different fragmentation behaviour that you will have to learn.
- reach for it when
- Long-running, heavily threaded services. A drop-in LD_PRELOAD makes it an afternoon experiment.
The 42× in 7.2. Allocation becomes a pointer bump and deallocation becomes resetting one offset.
- where it breaks
- You must be certain nothing outlives the arena. A single escaping pointer is a use-after-free: using memory after it has been given back.
- reach for it when
- Parsers, compilers, request handlers: anywhere a batch of objects all die together.
?Does swapping the allocator ever help?
Sometimes it's the whole fix. Mozilla adopted jemalloc for Firefox largely to fight fragmentation in a long-running browser process, where RSS climbing over hours was the user-visible complaint, not allocation speed.
And sometimes the answer is to stop using a general allocator. Many compilers allocate syntax-tree and intermediate-representation nodes in per-phase arenas and free each phase wholesale. No individual node is ever freed, and no free list is ever walked. If your objects have a common death date, a general allocator is solving a problem you don't have.
8.3Rules that hold up
- Compare RSS with live bytes before calling anything a leak. A flat gap is fragmentation (section 5.1).
- Allocate and free on the same thread where you can, so blocks aren't stranded in another thread's cache (section 4.2).
- Reuse one big buffer instead of allocating and freeing megabyte buffers in a loop (section 4.3).
- Grow buffers by a constant factor, never by a fixed increment (section 6.2).
- Give a burst of short-lived objects its own arena when they all die together (sections 5.1 and 7.2).
- Change the allocator only when a profile names it. Then jemalloc or mimalloc is an afternoon experiment (section 8.2).
8.4What you give up
| You get | You pay | When the bill arrives |
|---|---|---|
| Allocate anything, any size, any time | ~9 ns of bookkeeping per call | In allocation-heavy inner loops |
| Per-thread caches, no lock | Memory stranded in idle threads' caches | As RSS above what you expect |
| Freed memory reused quickly | It isn't returned to the OS | As RSS that never comes down |
| Size classes, O(1) allocation | A few percent internal fragmentation | Quietly, everywhere |
| An arena at 42× | Nothing may outlive the arena | As a use-after-free, later |
8.5Symptom, cause, fix
| Symptom | Likely cause | Fix |
|---|---|---|
| RSS climbs in a burst and never recovers | Fragmentation: survivors pin pages | Arena for the burst, malloc_trim, or a restart |
| RSS higher than expected on a many-threaded service | Memory stranded in thread caches or arenas | MALLOC_ARENA_MAX, or try jemalloc |
Profile shows time in malloc and free in a hot loop | General allocation for objects with a shared lifetime | A request-scoped arena |
| Loop over big buffers spends its time in the kernel | Allocations past the mmap threshold | Reuse one buffer |
| Two threads slower than one with no shared data | Allocator-induced false sharing | Pad the allocation to a cache line |
| Buffer growth gets slower as it grows | realloc by a fixed increment | Grow by a constant factor |
09Summary
- Freeing doesn't shrink a process. The program in section 1 freed all 500,000 nodes and still held 495.7 MB, because the allocator keeps what it frees.
- The allocator is a middleman. It gets big chunks from the kernel and cuts them into pieces, because a syscall and a whole page per object would be absurd.
mallocpromises very little. No time bound, no return to the OS, no locality, no bound on fragmentation.- A bump allocator is the fastest possible allocator and can't free anything. A free list fixes that and creates fragmentation, because a hole of the wrong size is no use to the next request.
- Size classes trade memory for speed. Rounding 40 up to 48 wastes a few percent and turns allocation into a list pop.
- Per-thread caches remove the lock from the fast path, at the price of memory stranded in other threads' caches.
- Allocate and free on the same thread. Cross-thread freeing is the slow path in most allocators.
- Big allocations bypass the caches. 64 KB cost 73.4 ns against 9.5 ns at 256 bytes, and past 128 KB glibc goes to
mmapwith its syscall and page faults. - One live object pins a page. That's how RSS stays high with no leak.
- An arena was 42× faster than
mallocfor 16-byte objects that die together: 0.2 ns against 8.5 ns. - Change the allocator only when a profile names it. Then jemalloc or mimalloc is an afternoon
LD_PRELOADexperiment.
10Build this
Write an arena, then find where it stops winning.
- Fifty lines: a
char*cursor over a large block, with alignment rounding and areset(). (Alignment is the part people get wrong. Round the cursor up before you hand it out, not the size afterwards.) - Benchmark it against
mallocfor 16, 64, 256 and 4,096 byte objects. Write one byte into every object, or the compiler may delete the loop, and expect the arena's numbers to include that first touch. The ratio should shrink as objects get bigger: the arena does roughly the same work at every size, so there's less for it to beat. - Then make it realistic: keep 100,000 objects live instead of freeing each immediately, and re-measure
malloc. Its thread cache stops being a free win and the gap widens. - Finally, measure peak RSS for both. The arena probably uses more memory, because it never reuses a freed slot and its high-water mark is the sum of everything you ever allocated. Seeing that trade in your own numbers is the point.
11Interview questions
beginnerYour service freed a lot of memory and RSS didn't drop. Is that a leak?›
Probably not. Allocators keep freed memory in their own pools for reuse instead of returning it, and a page can only go back to the OS when every object on it is free. One live object pins a whole page.
So a burst that scatters allocations across many pages can leave RSS permanently high with a small live set. Compare RSS against the sum of live allocations. A large, stable gap is fragmentation, and a leak would keep growing.
intermediateWhy do allocators use per-thread caches?›
To avoid a lock on every allocation. A single global free list means every allocation contends, and chapter 13 measures what that costs. With a per-thread cache, the fast path is a list pop with no atomics at all, and shared structures are touched only on refill or overflow.
The cost is that memory freed on one thread sits in that thread's cache and isn't available elsewhere until a flush, so allocate and free on the same thread where you can.
intermediateWhen is an arena the right choice, and what's the risk?›
When a batch of objects share a lifetime: parse trees, per-request state, a compiler phase. Allocation becomes a pointer bump, about 0.2 ns against 8.5 ns for malloc, roughly 42×, and deallocation is resetting one offset.
The risk is a pointer escaping the arena's lifetime. There's no per-object free, so nothing catches it, and you get a use-after-free that reproduces rarely.
deepWhy does allocation cost jump at large sizes?›
Past a threshold (128 KB in glibc by default) allocators bypass their heap and call mmap directly, so you pay a syscall on allocation and munmap on free. The returned pages are also untouched, so you pay a minor page fault on the first write to each one, about 686 ns per page for a first touch (chapter 04).
On a fast laptop, malloc plus free is about 9.5 ns at 256 bytes and about 73 ns at 64 KB, where the allocator has moved off its small-block fast path. A loop that keeps allocating and freeing fresh large buffers can spend most of its time in the kernel, so reuse one buffer instead.
deepTwo threads allocate small objects and performance is worse than one. Neither shares data.›
Likely false sharing introduced by the allocator. If both threads receive addresses in the same cache line, their independent writes invalidate each other's copy: chapter 13's 55× with no shared data and no lock.
Per-thread caches usually prevent it by carving each thread's objects from its own span, but it still happens near span boundaries and with allocators that lack them. If a struct is written by exactly one thread and lives next to another's, pad the allocation to a cache line, not just the struct.
12Go deeper
Roughly what does a small malloc+free pair cost?›
Single-digit nanoseconds on a warm thread cache: about 8.5 ns at 16 bytes on a fast laptop. Under a few hundred bytes the size barely matters.
Why can't the allocator return a mostly-free page to the OS?›
Because one live object anywhere on it pins the whole page. Pages are the unit of return, objects are not.
Growing a buffer by a fixed 1 KB each time. What's the complexity?›
O(n²) in bytes copied. Grow by a constant factor instead. That's what makes vector's push_back amortised O(1).
When does a bump allocator beat malloc by 40x?›
When every object dies at the same time, so you never free individually. Allocation collapses to a pointer increment.
The memory API and free-space management, which build free lists, splitting and coalescing one step at a time. Free online at ostep.org.
Why per-thread arenas and size classes are shaped the way they are, from the person who built the allocator most servers end up using.
A newer design with free-list sharding and unusually readable source. Good to read precisely because it's small enough to finish.
The clearest modern argument for arenas, framed around object lifetimes instead of around speed.
jemalloc's built-in statistics. Fragmentation stops being a guess the moment you can see the bin histogram.
13Related chapters
Where the allocator's pages come from, lazy allocation, and the 686 ns first
touch behind every fresh mmap. Chapter 04.
Why locality matters more than allocation cost, and the cache lines behind allocator-induced false sharing. Chapter 02.
The per-call cost that makes asking the kernel for every object absurd. Chapter 07.
What a contended global free list would cost, and the 55× false-sharing penalty. Chapter 13.