You've written a small web service and packaged it as a container image. To keep the example concrete we'll use nginx, the web server, as a stand-in for it. You write a short file, web.yaml, saying you want three copies of it running, and you type kubectl apply -f web.yaml, using Kubernetes' command-line tool. After roughly a minute, kubectl get pods lists three copies, all Running, spread over two machines, and requests sent to one address are shared among them. Delete one copy by hand and a replacement appears a few seconds later, without you doing anything.
It's tempting to picture kubectl logging into those machines and starting the containers. It doesn't. It sends one HTTP request carrying your file, gets back the word created, and exits, long before any container exists. No program in the cluster ever receives an instruction like "start three nginx containers on these two machines". Instead, several separate programs, none of which call each other, each notice a change in a shared database, write a change of their own, and go back to waiting. Running containers are the last link in a chain of those writes.
That arrangement is the core idea of Kubernetes, and it explains both why the system heals itself and how it fails. This chapter asks one question the whole way through: between kubectl apply and a running pod, what happens, and what keeps three copies running afterwards? We'll watch the whole chain on a real cluster first, then take it apart link by link, from the API server and the database behind it, through the loops that compare what you asked for with what exists, down to the node that starts the process and the rules that route traffic to it, and finish with what breaks first when a cluster grows to thousands of machines.
01One apply, followed on a real cluster
1.1The file and the cluster
Here is the whole of web.yaml. It describes two things, separated by ---.
apiVersion: apps/v1
kind: Deployment
metadata:
  name: web
spec:
  replicas: 3
  selector:
    matchLabels: {app: web}
  template:
    metadata:
      labels: {app: web}
    spec:
      containers:
      - name: nginx
        image: nginx:1.29
        ports: [{containerPort: 80}]
        resources:
          requests: {cpu: 100m, memory: 64Mi}
---
apiVersion: v1
kind: Service
metadata:
  name: web
spec:
  selector: {app: web}
  ports: [{port: 80}]
The first part is a Deployment, a Kubernetes object that means "keep this many copies of this pod running". A pod is the unit Kubernetes runs: one or more containers that are started together on the same machine and share a network address. Ours has one container, nginx. Its template is the pod to copy, and replicas: 3 says how many copies. That template also attaches a label, app: web, a key and value used as a tag. A Deployment's selector is a query over labels, and it's how the Deployment recognises its own pods: any pod labelled app: web counts. Lastly, requests tells the scheduler, the part of Kubernetes that picks a machine for each pod, how much CPU and memory each copy needs; chapter 36 covers what it does with them.
Below the --- is a Service, an object that gives the pods matching its selector a single stable address. Section 10 shows how that address works.
We need a cluster to send this to. A cluster is a group of machines, called nodes, managed together. kind ("Kubernetes in Docker") builds one on a laptop: each node is a Docker container that runs the same Kubernetes programs a real machine would. This configuration asks for one node to run the cluster's own management programs and two worker nodes for our pods:
cat > kind.yaml <<'EOF'
kind: Cluster
apiVersion: kind.x-k8s.io/v1alpha4
nodes: [{role: control-plane}, {role: worker}, {role: worker}]
EOF
kind create cluster --config kind.yaml # nodes: kind-control-plane, kind-worker, kind-worker21.2Trying it: who wrote what
Kubernetes components leave notes about what they did, in objects called Events. Each Event records which component wrote it (source.component), a one-word reason, the object it's about, and a message. They're the easiest way to see who did what after an apply.
These commands apply the file, wait for the Deployment to finish with kubectl rollout status, and then list the Events. --field-selector involvedObject.kind!=Node hides the notes the nodes wrote about themselves while starting up. --sort-by=.metadata.resourceVersion orders the Events by a counter the cluster increases on every write, so they come out in the order they were written; section 3 explains the counter. -o custom-columns picks four fields to print.
kubectl apply -f web.yaml
kubectl rollout status deploy/web
kubectl get events --sort-by=.metadata.resourceVersion --field-selector involvedObject.kind!=Node \
-o custom-columns=FROM:.source.component,REASON:.reason,OBJECT:.involvedObject.name,MESSAGE:.messagedeployment.apps/web created
service/web created
Waiting for deployment "web" rollout to finish: 0 of 3 updated replicas are available...
Waiting for deployment "web" rollout to finish: 1 of 3 updated replicas are available...
Waiting for deployment "web" rollout to finish: 2 of 3 updated replicas are available...
deployment "web" successfully rolled out
FROM REASON OBJECT MESSAGE
deployment-controller ScalingReplicaSet web Scaled up replica set web-95c78cc8b from 0 to 3
replicaset-controller SuccessfulCreate web-95c78cc8b Created pod: web-95c78cc8b-8cmxk
replicaset-controller SuccessfulCreate web-95c78cc8b Created pod: web-95c78cc8b-5xk2d
default-scheduler Scheduled web-95c78cc8b-8cmxk Successfully assigned default/web-95c78cc8b-8cmxk to kind-worker
replicaset-controller SuccessfulCreate web-95c78cc8b Created pod: web-95c78cc8b-2nxvm
endpoint-controller FailedToCreateEndpoint web Failed to create endpoint for service default/web: endpoints "web" already exists
default-scheduler Scheduled web-95c78cc8b-5xk2d Successfully assigned default/web-95c78cc8b-5xk2d to kind-worker2
default-scheduler Scheduled web-95c78cc8b-2nxvm Successfully assigned default/web-95c78cc8b-2nxvm to kind-worker
kubelet Pulling web-95c78cc8b-8cmxk Pulling image "nginx:1.29"
kubelet Pulling web-95c78cc8b-5xk2d Pulling image "nginx:1.29"
kubelet Pulling web-95c78cc8b-2nxvm Pulling image "nginx:1.29"
kubelet Pulled web-95c78cc8b-5xk2d Successfully pulled image "nginx:1.29" in 29.573s (29.573s including waiting). Image size: 61310317 bytes.
kubelet Created web-95c78cc8b-5xk2d Container created
kubelet Started web-95c78cc8b-5xk2d Container started
kubelet Pulled web-95c78cc8b-8cmxk Successfully pulled image "nginx:1.29" in 31.679s (31.679s including waiting). Image size: 61310317 bytes.
kubelet Created web-95c78cc8b-8cmxk Container created
kubelet Started web-95c78cc8b-8cmxk Container started
kubelet Pulled web-95c78cc8b-2nxvm Successfully pulled image "nginx:1.29" in 2.59s (34.264s including waiting). Image size: 61310317 bytes.
kubelet Created web-95c78cc8b-2nxvm Container created
kubelet Started web-95c78cc8b-2nxvm Container startedRead the FROM column top to bottom. Leaving aside the endpoint-controller line for now, four different programs wrote these lines.
deployment-controllersaw the new Deployment and created a ReplicaSet calledweb-95c78cc8b. A ReplicaSet is a simpler object that keeps a fixed number of identical pods running. A Deployment manages ReplicaSets, one per version of the pod template, so that it can move from one version to the next (section 5.4).replicaset-controllersaw the new ReplicaSet, which wanted three pods and had none, and created three pod objects.default-schedulersaw three pods with no machine assigned and picked a node for each: two onkind-worker, one onkind-worker2.kubelet, the agent that runs on every node, saw pods assigned to its own node, downloaded the image and started the containers.
Most of the minute went on downloading the 61 MB image: each pull took roughly 30 seconds. On kind-worker, the third pod's pull took 2.6 seconds but 34 "including waiting", because the kubelet pulls one image at a time by default and it queued behind the first pull there. That FailedToCreateEndpoint line looks like an error and turns out to be harmless; section 5.3 explains it.
1.3Records, and the programs that watch them
What the Events show is a pattern, and it's the model for the rest of the chapter. Everything in the cluster is a record, a small structured object such as a Deployment, a ReplicaSet or a pod, kept in one shared store. Most records have two halves. The spec says what someone wants ("3 replicas of this template"). The status says what has been observed ("3 replicas exist, 3 are ready"). Programs called controllers each watch one kind of record, compare its spec with what exists, and write whatever records would close the gap. None of them talks to another directly. They only read and write records.
This style is called declarative: you describe the end state you want, and the system works out the steps. Its opposite, imperative, is a list of commands ("start a container on node 2").
Programs involved have names worth learning now. Those that manage the cluster as a whole are called the control plane: the API server, the program every read and write goes through; etcd, the database the API server keeps the records in; the scheduler; and the controller manager, one process that hosts several dozen controllers, including the Deployment and ReplicaSet controllers. Every node runs a kubelet, and also kube-proxy, needed in section 10. Chapter 36 has the official picture of these parts. Here's the apply from the TryIt, as records being written:
kubectl apply writes one record, the Deployment web with replicas: 3, and exits. Nothing else exists yet.?Why not have kubectl start the containers itself?
Because the work isn't finished when the containers start. Suppose a node loses power at 3 a.m. If kubectl had started the containers directly, nothing would remember that three were wanted, and nobody is awake to run the command again. Because the request is a record, the ReplicaSet controller notices three pods wanted and two existing, and creates another, at 3 a.m. or any other time. So the same loop that started the pods keeps them running.
Kubernetes' authors describe this choice in their 2016 ACM Queue paper, Borg, Omega, and Kubernetes. A controller "compares a desired state (e.g., how many pods should match a label-selector query) against the observed state (the number of such pods that it can find), and takes actions to converge the observed and desired states." They call the whole design "control through choreography": many independent loops, each doing one job, with no central conductor telling them what to do in what order.
Every arrow in the scene went into or out of one box, and that box comes first.
02The API server, the only door
2.1Why every write goes through one program
The controllers, the scheduler and the kubelets all need the same records. One obvious design would let each of them read and write the database directly. Kubernetes' predecessors at Google tried two different designs. In Borg, one large central program, the Borgmaster, knew the meaning of every operation and ran the database itself. In Omega, its successor, every component read and wrote a shared store directly, and the store did little more than keep the data and detect conflicting writes.
Omega's approach made components independent, but it put every rule into every client. If pods must never have a negative replica count, every program that writes pods has to check that, using the same library at the same version. Kubernetes keeps Omega's independent components and adds one gatekeeper. In the paper's words, it works "by forcing all store accesses through a centralized API server that hides the details of the store implementation and provides services for object validation, defaulting, and versioning."
So the API server (kube-apiserver) is the only program that talks to etcd. Everything else, including the controllers, the scheduler and every kubelet, is a client of the same HTTP interface that kubectl uses. Each record has a URL. Our Deployment lives at /apis/apps/v1/namespaces/default/deployments/web: apps/v1 is the API group and version, default is the namespace (a named partition of the cluster, usually one per team or application), and web is the name. Creating a record is a POST, reading it is a GET, changing it is a PUT or PATCH.
2.2What happens to one request
Before a request reaches etcd it passes through a fixed series of checks. This picture from the Kubernetes documentation shows the main ones:
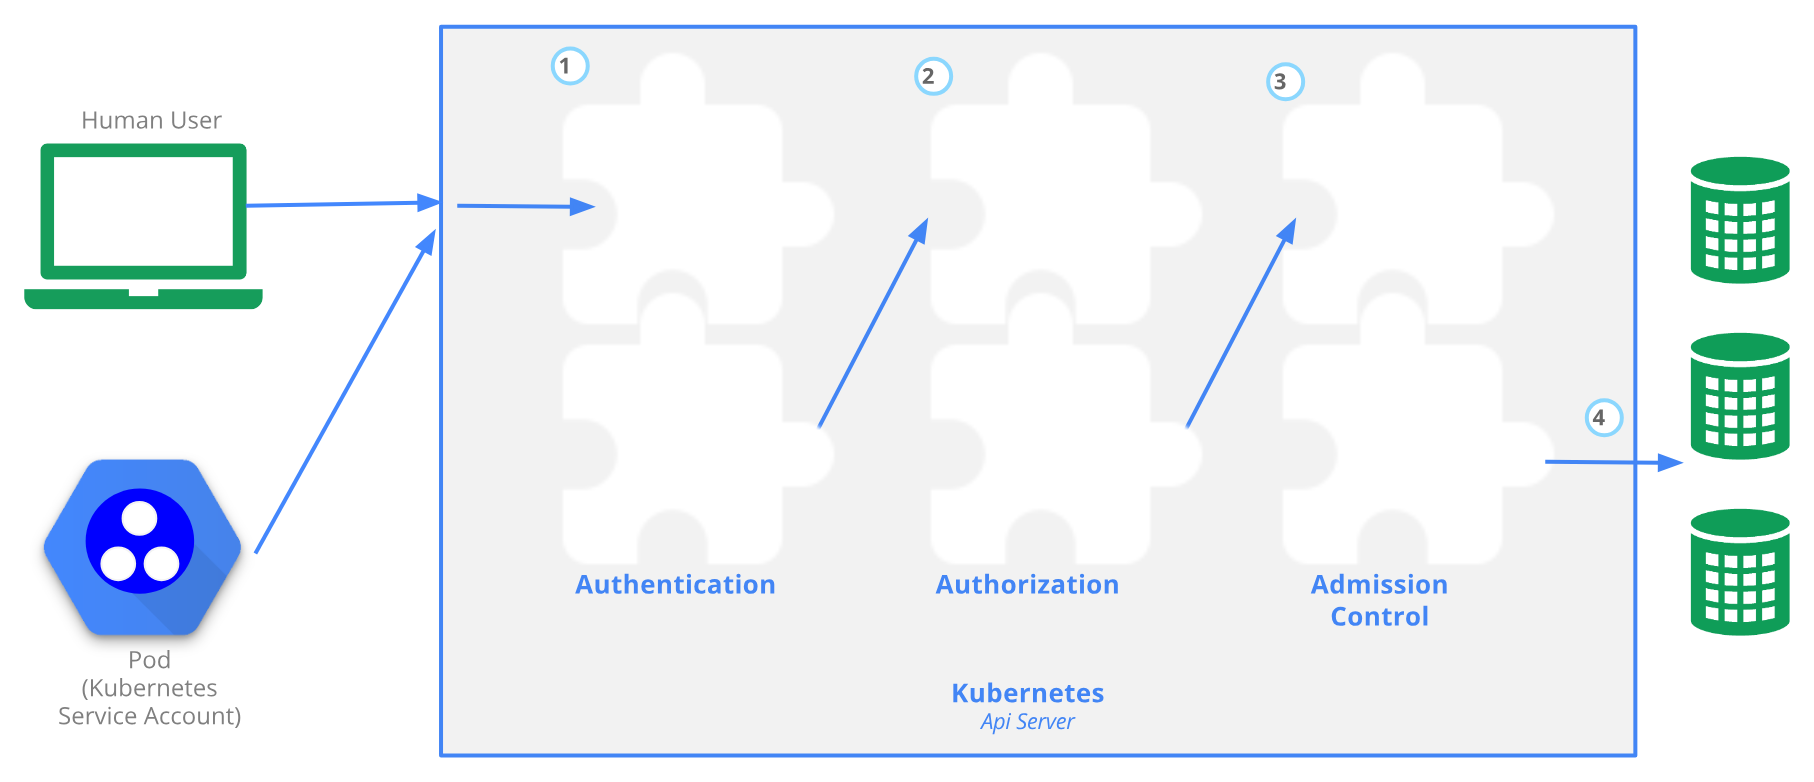
- Authentication answers "who is this?" from a client certificate or a token. People usually authenticate with certificates or a single sign-on token. Programs running in pods use a service account, an identity the cluster issues to pods, carried as a token. A request with no credentials at all is given the user name
system:anonymous. - Authorization answers "may this user do this verb to this kind of record?" Most clusters use RBAC (role-based access control): rules like "the user
alicemaylistandgetpodsin namespaceshop". - Admission runs a chain of plugins called admission controllers that may change the object (mutating admission) or reject it (validating admission). Some are built in. Clusters can add their own as webhooks, HTTP services the API server calls before storing an object.
- Validation checks the object against its schema, and defaulting fills in every field you left out. Then the record is written to etcd.
Each stage can be watched turning a request away. First, curl sends a request with no credentials at all. Next, kubectl --as sends one as the default namespace's service account, an identity that exists but has been granted nothing. Then a patch tries to set the replica count to −1. Finally, a jsonpath query prints the tolerations of one of our pods, a field we never wrote. (A toleration lets a pod stay on, or be placed on, a node carrying a matching mark called a taint; chapter 36 explains both.)
SERVER=$(kubectl config view --minify -o jsonpath='{.clusters[0].cluster.server}')
curl -sk $SERVER/api/v1/namespaces/default/pods | grep message
kubectl get pods --as=system:serviceaccount:default:default
kubectl patch deploy web -p '{"spec":{"replicas":-1}}'
kubectl get pods -l app=web -o jsonpath='{.items[0].spec.tolerations}{"\n"}' "message": "pods is forbidden: User \"system:anonymous\" cannot list resource \"pods\" in API group \"\" in the namespace \"default\"",
Error from server (Forbidden): pods is forbidden: User "system:serviceaccount:default:default" cannot list resource "pods" in API group "" in the namespace "default"
The Deployment "web" is invalid: spec.replicas: Invalid value: -1: must be greater than or equal to 0
[{"effect":"NoExecute","key":"node.kubernetes.io/not-ready","operator":"Exists","tolerationSeconds":300},{"effect":"NoExecute","key":"node.kubernetes.io/unreachable","operator":"Exists","tolerationSeconds":300}]The anonymous request got through authentication, as the user system:anonymous, and was stopped by authorization. Our service account was identified correctly and also stopped by authorization, because nobody granted it permission to list pods. A negative replica count passed both and was stopped by validation, before anything was stored. The last line shows admission at work: an admission controller called DefaultTolerationSeconds added two tolerations to every pod, which let a pod stay on a node that has stopped responding for 300 seconds before it's moved. Section 9.4 comes back to those 300 seconds.
Requests from the scheduler and the controllers go through this same pipeline, and that's why there's only one door. Once a request passes all of it, the API server writes the record to etcd. So what does that record look like there?
03etcd, where the cluster's state lives
3.1A Deployment inside etcd
etcd is a key-value store: it maps keys (strings) to values (bytes). It keeps several copies on different machines and uses the Raft algorithm to agree on every write, so a write it acknowledges survives the loss of a minority of its members. Chapter 27 follows a single write through that algorithm, so here we can treat etcd as one reliable store and look at what Kubernetes puts in it.
The API server stores each record under a key built from its kind, namespace and name, below the prefix /registry. In kind, the control-plane node runs etcd as a pod, so we can run etcd's own client, etcdctl, inside it with kubectl exec. It needs etcd's certificates, kept at fixed paths on that node; the shell function below just saves typing them each time. --keys-only prints keys without values, and -w fields prints every field of the reply on its own line.
etcdctl() {
  kubectl -n kube-system exec etcd-kind-control-plane -- etcdctl \
    --cacert /etc/kubernetes/pki/etcd/ca.crt --cert /etc/kubernetes/pki/etcd/server.crt \
    --key /etc/kubernetes/pki/etcd/server.key "$@"
}
etcdctl get /registry --prefix --keys-only | grep web | grep -v events
etcdctl get /registry/deployments/default/web -w fields | grep -E '"(CreateRevision|ModRevision|Version)"'
kubectl get deploy web -o jsonpath='{.metadata.resourceVersion}{"\n"}'
etcdctl get /registry/deployments/default/web --print-value-only | head -c 3; echo
etcdctl endpoint status -w fields | grep -E '"(Revision|DBSize|DBSizeQuota)"'/registry/deployments/default/web
/registry/endpointslices/default/web-mpv42
/registry/pods/default/web-95c78cc8b-2nxvm
/registry/pods/default/web-95c78cc8b-5xk2d
/registry/pods/default/web-95c78cc8b-8cmxk
/registry/replicasets/default/web-95c78cc8b
/registry/services/endpoints/default/web
/registry/services/specs/default/web
"CreateRevision" : 669
"ModRevision" : 783
"Version" : 7
783
k8s
"Revision" : 824
"DBSize" : 1662976
"DBSizeQuota" : 2147483648Every record from section 1 is here as one key: the Deployment, the ReplicaSet, the three pods, the Service, and two records we didn't write, which list the pods behind the Service (section 10). Each value starts with the letters k8s, because the API server stores records in protobuf, a compact binary encoding, behind a short k8s header, so a pod takes roughly 3.4 KB in etcd against nearly 8 KB as the JSON kubectl shows you.
Those three numbers in the middle are the interesting part. Version: 7 says this key has been written seven times. You wrote it once. Six more came from the Deployment controller, which notes which version of the template is current and updates the Deployment's status as replicas are created and become ready. ModRevision: 783 is a number etcd stamped on the latest of those writes, and it's exactly the Deployment's resourceVersion, the field kubectl shows. To see where those numbers come from, we need a small etcd of our own.
3.2Revisions: a number for every change
etcd keeps one counter for the whole store, the revision. Every write, to any key, increases it by one, and the write is stamped with the new value. Each key remembers the revision that created it (CreateRevision), the revision of its latest change (ModRevision), and how many times it has changed (Version). etcd also keeps the old values: writing a key adds a new version and leaves the previous one in place. This is called multi-version concurrency control, or MVCC. So you can read the store as it was at an earlier revision, and ask for every change after a given revision.
Kept forever, old versions would fill the disk, so they are discarded on request. Compaction at revision n throws away every superseded value older than n. After that, nobody can read or replay history from before n.
This experiment starts a throwaway, single-member etcd on your machine (brew install etcd installs it, or run the quay.io/coreos/etcd image). Run it in a new terminal, so that etcdctl is the real client again and not the function from the last experiment. It writes our Deployment key twice and a pod key once, reads the Deployment's fields, reads it again as of revision 2 with --rev=2, and replays every change since revision 2 with watch --rev=2. A watch waits for more changes forever, so the script stops it after a second. Then it compacts at revision 4 and tries both again.
etcd --data-dir demo.etcd 2>etcd.log &      # a throwaway one-member etcd on localhost:2379
sleep 2
etcdctl put /registry/deployments/default/web 'replicas: 3'
etcdctl put /registry/pods/default/web-a 'nodeName: ""'
etcdctl put /registry/deployments/default/web 'replicas: 4'
etcdctl get /registry/deployments/default/web -w fields | grep -E '"(Revision|CreateRevision|ModRevision|Version|Value)"'
etcdctl get /registry/deployments/default/web --rev=2 --print-value-only
etcdctl watch --prefix /registry/ --rev=2 & sleep 1; kill $!; wait $! 2>/dev/null
etcdctl compact 4
etcdctl get /registry/deployments/default/web --rev=2 2>&1 | tail -1
etcdctl watch --prefix /registry/ --rev=2 2>&1 | head -1
kill %1OK
OK
OK
"Revision" : 4
"CreateRevision" : 2
"ModRevision" : 4
"Version" : 2
"Value" : "replicas: 4"
replicas: 3
PUT
/registry/deployments/default/web
replicas: 3
PUT
/registry/pods/default/web-a
nodeName: ""
PUT
/registry/deployments/default/web
replicas: 4
compacted revision 4
Error: etcdserver: mvcc: required revision has been compacted
watch was canceled (etcdserver: mvcc: required revision has been compacted)A fresh store starts at revision 1, so our three writes became revisions 2, 3 and 4. Our Deployment key was created at 2 and last changed at 4, and it has two versions. Reading at --rev=2 returned replicas: 3, the value as it was then. Watching from revision 2 replayed all three writes in order, the pod in between, so a program that had stopped at revision 2 could catch up exactly. After compacting at 4, both requests for revision 2 fail, because that history no longer exists.
Every one of those ideas is in Kubernetes. A record's resourceVersion is its key's ModRevision. Kubernetes' API server compacts etcd every five minutes by default (DefaultCompactInterval in its storage code), so Kubernetes history is short. And a program that falls too far behind gets an error and has to start over, which section 4 will show from the Kubernetes side.
3.3How much etcd can hold
etcd was built for small, important data, and its limits say so. Per the etcd limits page, one request may be at most 1.5 MiB by default. And the whole database has a default space quota of 2 GiB (the DBSizeQuota of 2,147,483,648 bytes in the TryIt), and 8 GiB is the suggested maximum for normal environments; etcd warns at startup if you configure more. Kubernetes adds its own, smaller limits on top, such as the 1 MiB maximum for the data in a ConfigMap, an object that holds configuration for pods to read.
What happens at the quota is severe. According to etcd's maintenance guide, etcd then raises a cluster-wide alarm and "only accepts key reads and deletes". For Kubernetes that means no new pods, no status updates and no scaling until someone deletes data, defragments, and clears the alarm. Defragmentation is needed because compaction frees space inside etcd's file without returning it to the filesystem; it rebuilds the file and blocks that member while it runs, so it's done one member at a time.
Production clusters run three or five etcd members so that losing one doesn't stop writes. The most common layout, which kubeadm (the standard tool for setting up clusters) calls "stacked", puts one etcd member on each control-plane machine:
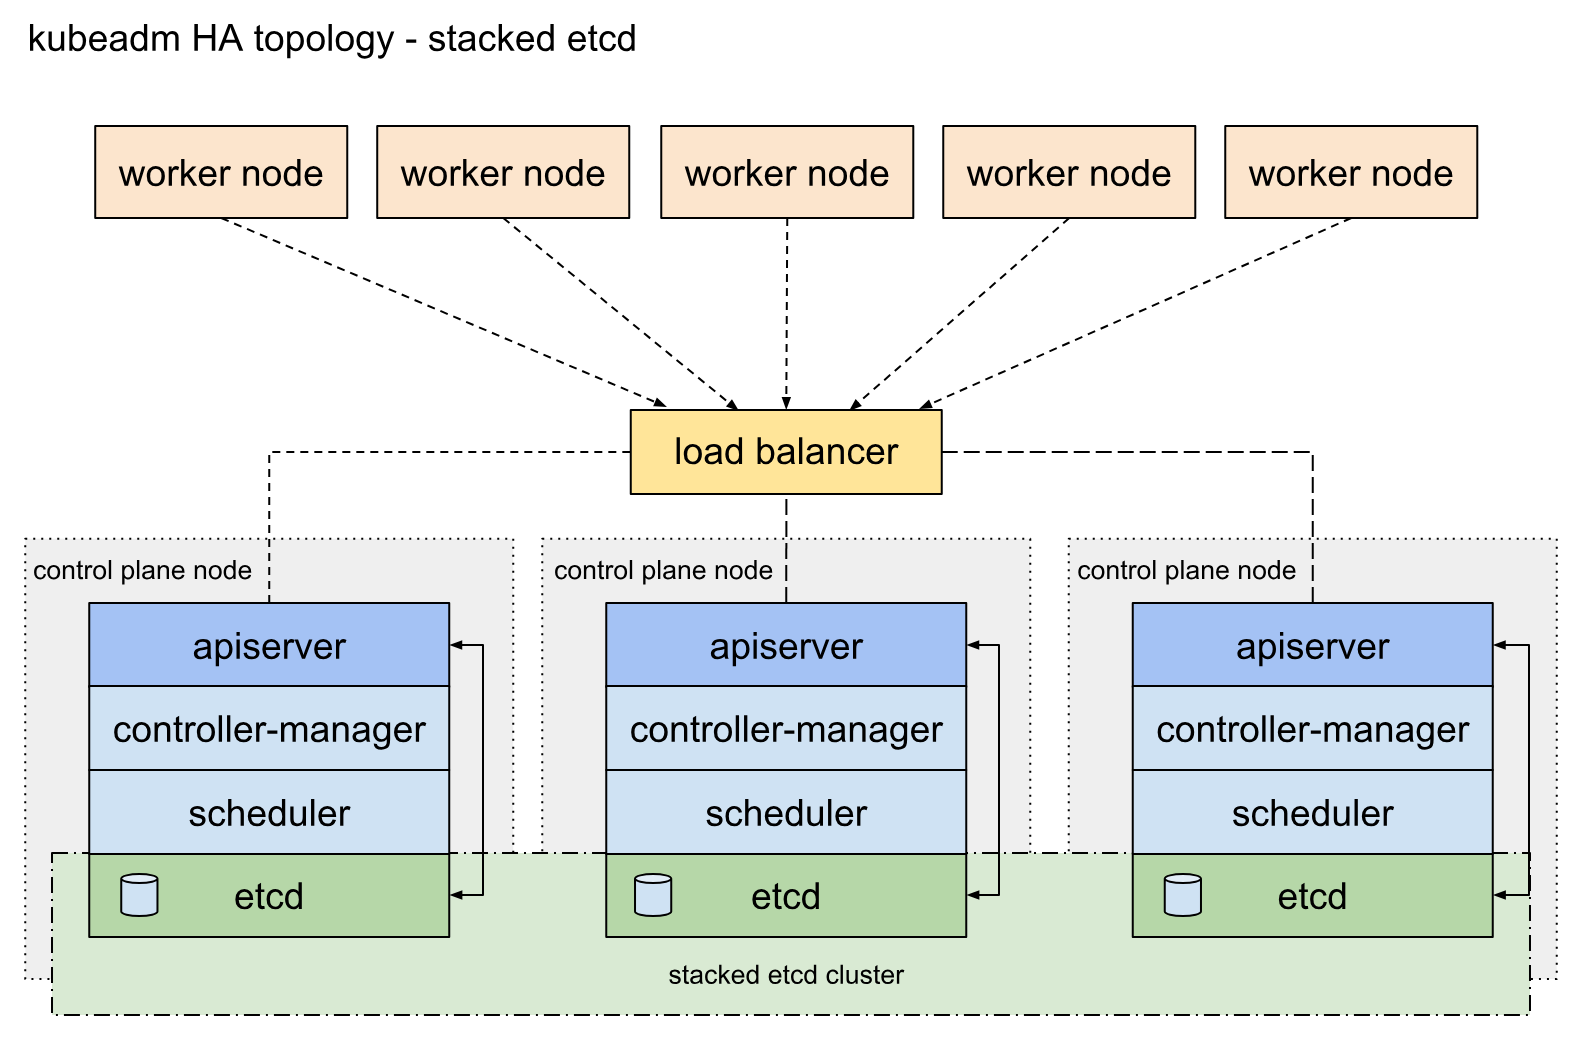
Revisions also do something more useful than limiting history. They let any program ask "what has changed since revision n?", and that is how every component in section 1 noticed its turn had come.
04Learning about changes: list and watch
4.1Polling costs too much
The ReplicaSet controller has to notice when one of our pods disappears. An obvious way is to ask every second: list all the pods, count them, compare. Now scale that up to the largest cluster Kubernetes supports, 5,000 nodes and 150,000 pods (section 12). Every kubelet needs its own pods, so 5,000 kubelets each asking once a second is 5,000 list requests a second, and each one makes the API server look through 150,000 pods for the 30 or so on that node: 750 million pod checks every second, almost all of them finding nothing new. A controller that lists every pod gets 150,000 × 3.4 KB, roughly half a gigabyte, from etcd on every poll.
Almost all of that work answers "has anything changed?" with "no". What we want is for the API server to tell each program when something changes, and to say nothing otherwise.
4.2A watch picks up where a list left off
That's what a watch is. A client first does a list, which returns the current records and also one resourceVersion for the list as a whole, meaning "this is the state as of revision n". Then it opens a watch from n, a long-lived HTTP response that streams one event per change: ADDED, MODIFIED or DELETED, each with the full new record. If the connection breaks, the client reconnects from the last resourceVersion it saw and misses nothing, exactly like etcdctl watch --rev in section 3.2.
kubectl can show you the stream. --watch keeps the command running and prints each change, and --output-watch-events adds the event type as the first column. This script runs it in the background, scales the Deployment to four replicas, waits, and scales it back to three. Its last command opens a raw watch from resourceVersion 1, a position long gone, and --request-timeout makes it give up after five seconds instead of waiting.
kubectl get pods -l app=web --watch --output-watch-events &
sleep 2; kubectl scale deploy web --replicas=4
sleep 10; kubectl scale deploy web --replicas=3
sleep 10; kill %1
kubectl get --raw '/api/v1/namespaces/default/pods?watch=1&resourceVersion=1' --request-timeout=5s; echoEVENT NAME READY STATUS RESTARTS AGE
ADDED web-95c78cc8b-2nxvm 1/1 Running 0 3m14s
ADDED web-95c78cc8b-5xk2d 1/1 Running 0 3m14s
ADDED web-95c78cc8b-8cmxk 1/1 Running 0 3m14s
deployment.apps/web scaled
ADDED web-95c78cc8b-vkdzv 0/1 Pending 0 0s
MODIFIED web-95c78cc8b-vkdzv 0/1 Pending 0 0s
MODIFIED web-95c78cc8b-vkdzv 0/1 ContainerCreating 0 0s
MODIFIED web-95c78cc8b-vkdzv 0/1 ContainerCreating 0 1s
MODIFIED web-95c78cc8b-vkdzv 1/1 Running 0 1s
deployment.apps/web scaled
MODIFIED web-95c78cc8b-vkdzv 1/1 Terminating 0 11s
MODIFIED web-95c78cc8b-vkdzv 1/1 Terminating 0 11s
MODIFIED web-95c78cc8b-vkdzv 0/1 Completed 0 11s
MODIFIED web-95c78cc8b-vkdzv 0/1 Completed 0 12s
MODIFIED web-95c78cc8b-vkdzv 0/1 Completed 0 12s
DELETED web-95c78cc8b-vkdzv 0/1 Completed 0 12s
{"type":"ERROR","object":{"kind":"Status","apiVersion":"v1","metadata":{},"status":"Failure","message":"too old resource version: 1 (437)","reason":"Expired","code":410}}Those first three ADDED lines are the list: the state as it was when the watch began, delivered as if each pod had just been added. Every line after that is one write to the fourth pod's record, and you can name the writer of each. The ReplicaSet controller created it (ADDED, Pending). The scheduler wrote a node name into it (MODIFIED, still Pending). The kubelet then reported the container being created, and running, in separate status writes. Scaling down produced the same story in reverse: Terminating means a deletion has been requested and the record has been marked with the time, the kubelet stopped the container and reported it in a few more status writes (Completed), and the final DELETED is the record leaving etcd.
The last line is the error a client gets when it asks for history the server no longer holds: HTTP status 410 Gone, reason Expired. In brackets, 437 is the oldest position the server could still replay from. A client that receives this has to throw away what it knows, list again, and watch from the new list's resourceVersion.
4.3One watch on etcd, many watchers
If every one of 5,000 kubelets opened its own watch on etcd, etcd would be sending each pod change 5,000 times. The API server avoids that with a watch cache: for each kind of record it holds one watch on etcd, keeps the current objects and a window of recent changes in memory, and serves every client's lists and watches from there, filtering for each client. A kubelet asks for pods whose spec.nodeName is its own node, and only those changes are sent to it.
That's why the 410 above talks about position 437 and not about etcd's compaction. This window lives in the API server's memory, and the API concepts docs say to expect changes from about the last 5 minutes to be kept; on our young cluster it already started at 437. To keep idle watchers from falling out of the window, the API server can send bookmark events that carry nothing but a newer resourceVersion, so a client that reconnects can start from a recent position even if none of its objects changed.
4.4Informers: each program's copy of the cluster
Writing list, watch, reconnect and relist correctly in every program would be tedious and easy to get wrong, so Kubernetes' Go client library, client-go, packages them as an informer. An informer keeps a local, in-memory copy of every record of one kind, its cache, kept up to date by a list followed by a watch. It calls handlers when records are added, updated or deleted. A controller's handlers don't do the work themselves. They put the name of the object that needs attention into a work queue, and worker threads take names off the queue and process them.
web pods, then opens a watch from the list's resourceVersion.Two details make this scale. First, the queue holds names, and a name already in the queue isn't added twice, so a burst of a hundred updates to one ReplicaSet's pods costs one reconcile. And informers are shared: the controller manager runs dozens of controllers but keeps one pod informer, so the API server sends each pod change to it once. Kubernetes' guidelines for writing controllers (controllers.md) say to use shared informers because it "saves us connections against the API server, duplicate serialization costs server-side, duplicate deserialization costs controller-side, and duplicate caching costs controller-side."
The worker in the scene did something specific with the event: it ignored what the event said and looked at the whole state. That choice is the subject of the next section.
05Reconciling: compare, then act
5.1Acting on events, and how it breaks
The obvious way to write the ReplicaSet controller is to react to each event: when a pod is deleted, create one. When replicas goes up by two, create two. That's called edge-triggered, a term from electronics, where an edge-triggered circuit reacts at the moment a signal changes. Its alternative, level-triggered, reacts to the signal's current value whenever it looks. Applied to controllers, an edge-triggered controller acts on what the event says changed, and a level-triggered one uses the event only as a prompt to compare the whole current state with the goal.
The edge-triggered version breaks whenever it misses an event, and there are three everyday ways to miss one:
- The controller was down. The controller manager restarts, say during an upgrade, and pods are deleted in the meantime. Nobody was watching, so those deletions are never delivered.
- The watch expired. A client that gets 410 Gone lists again. That list shows what exists now. A pod that was deleted during the gap is missing from it, and no
DELETEDevent will ever arrive for it. - Changes were merged. Your
replicaswent from 2 to 5 and then to 3 within a second. Depending on timing, the controller might see both changes, one of them, or only the final value.
Kubernetes' API conventions put the rule directly: "if a value is changed from 2 to 5 in one PUT and then back down to 3 in another PUT the system is not required to 'touch base' at 5 before changing the status to 3. In other words, the system's behavior is level-based rather than edge-based. This enables robust behavior in the presence of missed intermediate state changes." The controller guidelines say the same thing more bluntly: "Level driven, not edge driven", because "your controller may be off for an indeterminate amount of time before running again."
5.2A loop that compares levels
A level-triggered controller is the same idea as the governor James Watt fitted to his steam engines in the 1780s:
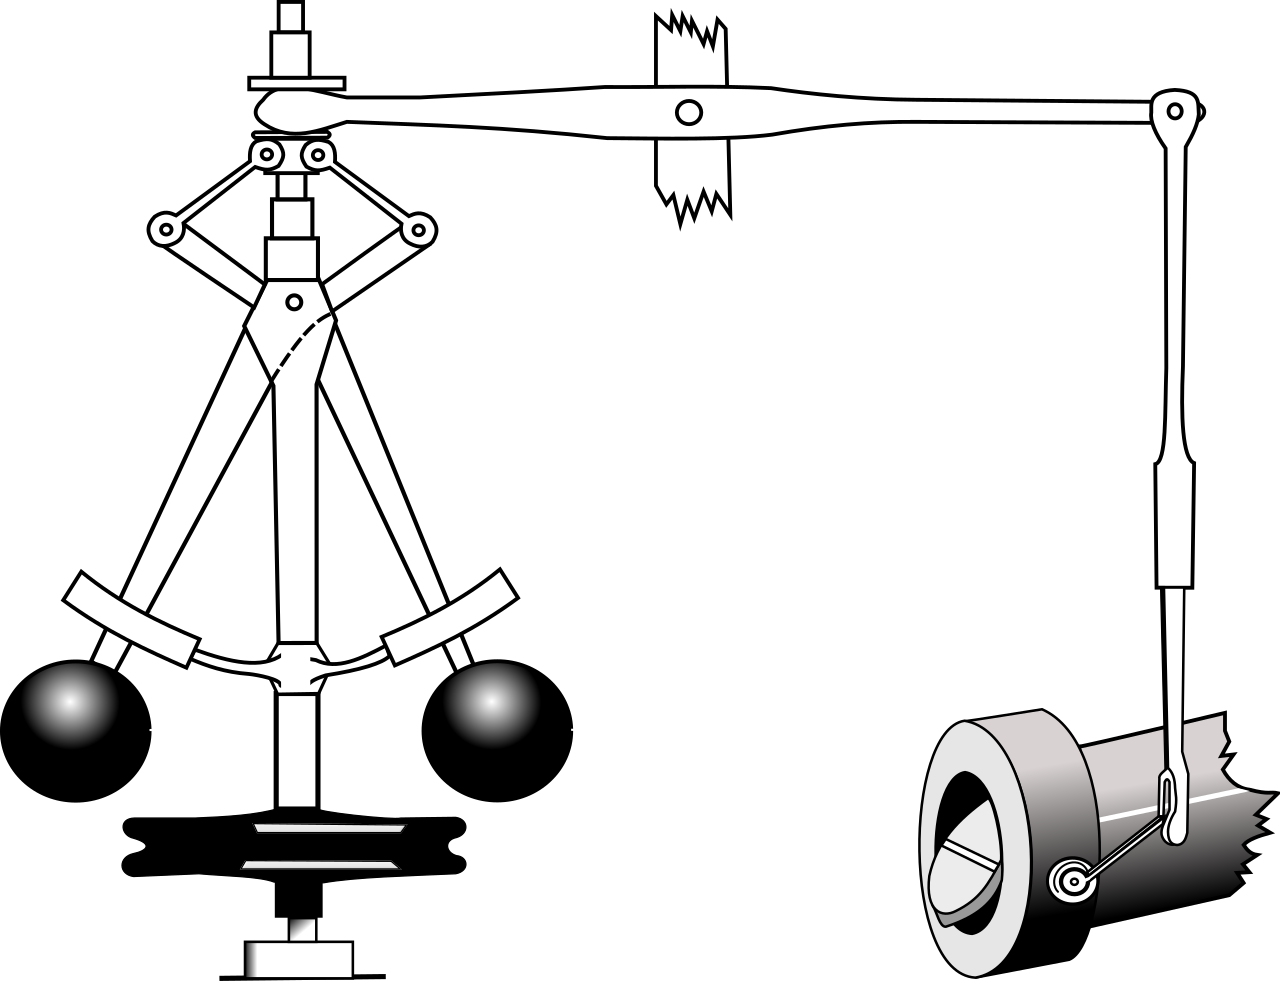
The ReplicaSet controller's core is the same kind of comparison. Here's the start of the function that adjusts a ReplicaSet's pods, from Kubernetes v1.37.0:
func (rsc *ReplicaSetController) manageReplicas(ctx context.Context, activePods []*v1.Pod, rs *apps.ReplicaSet) error {
	diff := len(activePods) - int(*(rs.Spec.Replicas))
	/* ... */
	if diff < 0 {
		diff *= -1
		if diff > rsc.burstReplicas {
			diff = rsc.burstReplicas
		}
		/* ... create diff pods ... */
	} else if diff > 0 {
		/* ... delete diff pods, preferring ones still starting up ... */
	}
The first line is the whole controller in miniature: the number of pods it can find minus the number wanted. Nothing in the function asks which event woke it up. (burstReplicas, 500, caps how many pods one pass changes, and creates go out in batches of 1, 2, 4, 8, so a ReplicaSet whose pods all fail the same way stops after the first failure.)
The small simulation below makes the difference concrete. A Cluster holds a set of pod names. Its edge controller creates a pod when told "pod deleted". The level controller ignores the event and compares counts. Both face the same afternoon: three pods are running, a node dies and takes two of them while the controller is restarting, so those two deletions are never delivered, and later one more pod dies and its event does arrive.
After that afternoon, how many pods does the edge-triggered controller leave running? (Three were wanted.)
Its second half runs the level controller against a lagging cache, the normal situation for every real controller, as the scene in section 4.4 showed. Its reconcile subtracts what the cache shows from 3, and the second version also subtracts the pods it has already asked for and not yet seen.
# Three pods for "web", two controllers, and a watch that misses things.
class Cluster:
    def __init__(self):
        self.pods, self.made = set(), 0
    def create(self):
        self.made += 1
        self.pods.add(f"web-{self.made}")
    def delete(self, pod):
        self.pods.discard(pod)

def edge(cluster, event, replicas):
    # React to the change the event describes.
    if event == "pod deleted":
        cluster.create()

def level(cluster, event, replicas):
    # Ignore what the event says; compare the whole state with the goal.
    diff = replicas - len(cluster.pods)
    for _ in range(diff):
        cluster.create()
    for pod in sorted(cluster.pods)[:max(0, -diff)]:
        cluster.delete(pod)

for name, controller in [("edge", edge), ("level", level)]:
    c = Cluster()
    for _ in range(3):
        c.create()
    # A node dies and takes two pods while the controller is restarting:
    # nobody is watching, so those two events are never delivered.
    c.delete("web-1"); c.delete("web-2")
    controller(c, "controller restarted", 3)
    # Later one more pod dies, and this time the event arrives.
    c.delete("web-3")
    controller(c, "pod deleted", 3)
    print(f"{name:5}  pods={len(c.pods)}  {sorted(c.pods)}")

# The level controller again, but reading from a cache that lags behind.
c = Cluster()
cache = set()                       # the controller's copy of the pod list
def reconcile(expected):
    missing = 3 - len(cache) - expected
    for _ in range(missing):
        c.create()
    return max(missing, 0)
reconcile(0)                        # sees 0 pods, creates 3
reconcile(0)                        # cache still empty: creates 3 more
print(f"stale cache, no memory:     pods={len(c.pods)}")
c = Cluster(); cache = set()
expected = reconcile(0)             # creates 3 and remembers they're coming
expected += reconcile(expected)     # 0 seen + 3 expected: creates none
print(f"stale cache, expectations: pods={len(c.pods)}")edge pods=1 ['web-4']
level pods=3 ['web-4', 'web-5', 'web-6']
stale cache, no memory: pods=6
stale cache, expectations: pods=3Those first two lines are the Predict: the edge controller ends with one pod, and the level controller with three. Notice that the level controller recovered at the restart itself, when it was woken by an event ("controller restarted") that said nothing about pods. Any event, or a timer, is enough of a reason to look.
Its last two lines show that level-triggering alone isn't enough. A controller that trusts a stale cache counts zero pods twice and creates six.
5.3When the cache is behind
That gap in the simulation is real. When the ReplicaSet controller creates three pods, the API server answers each create at once, but the pods reach the controller's own cache only later, through its watch. If anything wakes the controller for the same ReplicaSet in between, a level comparison against the cache would see too few pods and create more.
The ReplicaSet controller handles this with expectations: before creating pods it records "I expect to see 3 new pods for web-95c78cc8b", and each ADDED event that arrives counts one off. It won't reconcile that ReplicaSet again until its expectations are met, or until five minutes pass (ExpectationsTimeout), in case a create failed silently.
Since Kubernetes 1.36 the ReplicaSet controller has a second, more general guard (KEP-5647, beta and on by default). It records the resourceVersion of each write it makes, and before reconciling it checks that its cache has caught up to at least that position. That check only works because resourceVersions can be compared (section 3.2). If the cache is behind, the controller puts the work back in the queue and tries again shortly.
Now we can explain the odd line in section 1. The endpoints controller, which maintains the older Endpoints record for each Service, tried to create the web Endpoints record and was told it already existed. It's probably this section's story: it had created the record a moment earlier, its cache hadn't caught up, and its next pass tried again. After the API server refused the duplicate, a later pass with a fresh view found the record. Stale caches are normal; what matters is that the store refuses impossible writes and the next pass repairs the rest.
5.4Controllers on top of controllers: a rolling update
Why is there a ReplicaSet between the Deployment and its pods at all? Because a Deployment has to change versions without stopping the service, and ReplicaSets make that a matter of two counts.
Each ReplicaSet runs one version of the pod template. Its name ends in the pod-template-hash, a hash of the template; that's why our ReplicaSet is called web-95c78cc8b. Change the image to nginx:1.30 and the template's hash changes, so the Deployment controller creates a second ReplicaSet, web-7c477f6fd8, and moves replicas from the old one to the new one. Two settings bound how fast. maxSurge (default 25%, rounded up) is how many extra pods may exist during the change, and maxUnavailable (default 25%, rounded down) is how many fewer than the target may be ready. For 3 replicas that's 0.75 rounded up to 1 extra pod, and 0.75 rounded down to 0 missing ones: the Deployment adds one new pod, waits until it's ready, removes one old pod, and repeats.
web-7c477f6fd8 with 0 replicas. Three old pods are serving.Those steps are the order the Events show on the real cluster: "Scaled up replica set web-7c477f6fd8 from 0 to 1", "Scaled down replica set web-95c78cc8b from 3 to 2", and so on to 3 and 0. No single program runs the rollout as a script. The Deployment controller only ever writes two numbers, and the two ReplicaSet controllers each make their own counts true. If the controller manager restarts halfway, the next pass reads both counts and carries on.
Both the Deployment controller and you have now written to the same Deployment record within seconds of each other, and the Deployment controller writes its status continually. Something has to stop one writer from silently undoing the other's change.
06Two writers, one object
6.1The lost update
Suppose you fetch the Deployment to change its image, and you have a copy that says replicas: 3. While you edit, an autoscaler, a controller that adjusts replicas to match load, raises it to 4 because traffic is climbing. You send back your whole copy with the new image, and with replicas: 3, because that's what your copy said. If the store accepts it, the autoscaler's change is gone and nobody was told. This is a lost update: two read-modify-write sequences overlap, and the second overwrites the first.
A classic fix would be a lock: take it, read, modify, write, release. A lock held by a client that crashes or pauses blocks everyone else, and in a system of hundreds of independent programs, that's a common occurrence. Kubernetes uses the same approach as Omega, the system it descends from (covered in chapter 36), called optimistic concurrency: assume conflicts are rare, let everyone read and write freely, and detect the conflict at write time.
6.2resourceVersion as a compare-and-swap
Section 3's resourceVersion is the detector. When you replace an object, your copy carries the resourceVersion you read. The API server turns the write into an etcd transaction that says "if this key's ModRevision is still 1186, store the new value; otherwise do nothing", a pattern called compare-and-swap. If anyone else wrote the object in between, the revision has moved, the comparison fails, and the API server answers 409 Conflict.
replicas: 3, resourceVersion: 1186.You can cause this yourself. This script saves the Deployment, resourceVersion included, to a file, then changes the replica count behind the file's back, then tries to write the file back with kubectl replace, which sends the whole object as a PUT.
kubectl get deploy web -o yaml > stale.yaml      # your copy, resourceVersion included
grep resourceVersion stale.yaml
kubectl scale deploy web --replicas=4            # someone else changes the object
kubectl replace -f stale.yaml                    # you write back your old copy
kubectl scale deploy web --replicas=3 # put it back resourceVersion: "1186"
deployment.apps/web scaled
Error from server (Conflict): error when replacing "stale.yaml": Operation cannot be fulfilled on deployments.apps "web": the object has been modified; please apply your changes to the latest version and try again
deployment.apps/web scaledThat error message is the instruction every client follows: read the latest version, apply your change to it, try again. For a level-triggered controller that costs almost nothing, because it was going to recompute its change from the current state anyway. A conflict just puts the object's name back in the work queue.
6.3Patches, and who owns which field
Most writes don't need to replace the whole object, and avoid most conflicts by not doing so. A PATCH sends only the fields to change ("set replicas to 4"), and the API server applies it to the current version, so two writers changing different fields don't collide. kubectl scale sends a patch, which is why it never conflicted in the experiments.
kubectl apply goes one step further. By default it reads the live object, compares it with your file and with the last file you applied, and sends a patch for the difference. Server-side apply (kubectl apply --server-side) moves that work into the API server and records, for every field, which field manager last set it: kubectl, the autoscaler, a controller. If you apply a file that sets a field another manager owns, the API server reports a conflict naming that manager, and you choose whether to take the field over. Two owners of replicas is a real disagreement, and that's the moment to find out about it.
One more split keeps writers apart: spec and status are written through different URLs. The kubelet and the controllers write status through the /status subresource, and users write the spec, so a status update can't overwrite a spec edit or the other way round. Kubernetes' API conventions suggest giving them different permissions too: users can change the spec, and only the responsible controller can change the status.
So far every write has created or changed a record. Records also refer to each other, and deleting one raises the question of what happens to the records that depend on it.
07Ownership, garbage collection and finalizers
7.1Who owns whom
When the ReplicaSet controller created our pods, it wrote into each one an owner reference: a pointer in metadata.ownerReferences to the ReplicaSet, by kind, name and UID, an identifier the API server gives each object when it's created and never reuses. In the same way, the ReplicaSet points to the Deployment.
This experiment prints each object's UID next to its owner's name and UID. Then it deletes the ReplicaSet with --cascade=orphan, removing the ReplicaSet and leaving its pods alone, and prints the same columns again.
cols='KIND:.kind,NAME:.metadata.name,UID:.metadata.uid,OWNER:.metadata.ownerReferences[0].name,OWNER UID:.metadata.ownerReferences[0].uid'
kubectl get deploy,rs,pods -o custom-columns="$cols"
kubectl delete rs -l app=web --cascade=orphan    # delete the ReplicaSet, leave its pods
sleep 3
kubectl get rs,pods -o custom-columns="$cols"KIND NAME UID OWNER OWNER UID
Deployment web 40a655e9-f781-42d1-a19e-51b53ea36594 <none> <none>
ReplicaSet web-95c78cc8b 4aed8c0c-8684-4022-9601-6245285e31f4 web 40a655e9-f781-42d1-a19e-51b53ea36594
Pod web-95c78cc8b-2nxvm b7e5f915-d78f-408f-ac02-b777ee6b67f9 web-95c78cc8b 4aed8c0c-8684-4022-9601-6245285e31f4
Pod web-95c78cc8b-5xk2d efbd628b-6789-44cd-81df-a1d3a6bdf487 web-95c78cc8b 4aed8c0c-8684-4022-9601-6245285e31f4
Pod web-95c78cc8b-8cmxk c431824a-a007-41b0-a609-ffc053857fe0 web-95c78cc8b 4aed8c0c-8684-4022-9601-6245285e31f4
replicaset.apps "web-95c78cc8b" deleted from default namespace
KIND NAME UID OWNER OWNER UID
ReplicaSet web-95c78cc8b 714b4d6f-d4fa-495f-8e9d-ee59f8e6a326 web 40a655e9-f781-42d1-a19e-51b53ea36594
Pod web-95c78cc8b-2nxvm b7e5f915-d78f-408f-ac02-b777ee6b67f9 web-95c78cc8b 714b4d6f-d4fa-495f-8e9d-ee59f8e6a326
Pod web-95c78cc8b-5xk2d efbd628b-6789-44cd-81df-a1d3a6bdf487 web-95c78cc8b 714b4d6f-d4fa-495f-8e9d-ee59f8e6a326
Pod web-95c78cc8b-8cmxk c431824a-a007-41b0-a609-ffc053857fe0 web-95c78cc8b 714b4d6f-d4fa-495f-8e9d-ee59f8e6a326Three seconds later there's a ReplicaSet with the same name and a different UID, and the same three pods, with the same UIDs, now pointing at the new one. Two level-triggered loops did this without being told. The Deployment controller saw a Deployment with no ReplicaSet for its template and created one; the name came out the same because it's built from the template's hash. The new ReplicaSet's controller looked for pods matching its selector, found three with no owner, adopted them by writing itself in as their owner, and counted three of three. No pod was restarted.
UIDs are what make this safe. A name can be reused by a new object, as just happened; a UID can't. An owner reference that matched by name alone would let a new object inherit dependents it never created.
7.2Cascading deletion
Without --cascade=orphan, deleting an owner deletes its dependents, a process called cascading deletion, and a controller called the garbage collector does the work. It watches every kind of record, keeps a graph of all the owner references, and deletes any object whose owners are all gone. Kubernetes offers three modes, per the garbage collection docs:
| Mode | What happens when you delete the Deployment | When to use it |
|---|---|---|
| Background (the default) | The Deployment is deleted at once; the garbage collector then deletes the ReplicaSets, and after them the pods | Almost always |
| Foreground | The Deployment stays visible, marked as being deleted, until its dependents are gone, then disappears | When something must wait until everything is gone |
| Orphan | Only the Deployment is deleted; the dependents lose their owner reference and keep running | Replacing an owner without disturbing what it manages, as in the experiment |
Foreground deletion has to keep the owner around after the delete request, and it does that with the mechanism in the next subsection.
7.3Finalizers: a delete that waits
Some objects stand for something outside the cluster. A Service of type LoadBalancer corresponds to a load balancer rented from a cloud provider, and a PersistentVolume to a real disk. If the record vanished the moment you deleted it, the controller responsible would never get the chance to release the real thing, and you'd keep paying for it.
A finalizer is a key in the object's metadata.finalizers list that says "someone must clean up before this object goes". When you delete an object that has finalizers, the API server doesn't remove it. It sets metadata.deletionTimestamp to the time of the request, refuses any new finalizers, and returns. Now the object is Terminating. The controller that owns each finalizer sees the deletionTimestamp through its watch, does its cleanup, and removes its key. When the list is empty, the API server deletes the object for real. Foreground deletion uses a built-in finalizer, foregroundDeletion, which the garbage collector removes after the dependents are gone.
This experiment creates a small ConfigMap, adds a made-up finalizer that no controller handles, deletes it without waiting, inspects it, and then plays the part of the missing controller by removing the finalizer with a JSON patch.
kubectl create configmap note --from-literal=text="buy milk"
kubectl patch configmap note -p '{"metadata":{"finalizers":["example.com/archive-first"]}}'
kubectl delete configmap note --wait=false
kubectl get configmap note -o jsonpath='{.metadata.deletionTimestamp} {.metadata.finalizers}{"\n"}'
kubectl patch configmap note --type=json -p '[{"op":"remove","path":"/metadata/finalizers"}]'
kubectl get configmap noteconfigmap/note created
configmap/note patched
configmap "note" deleted from default namespace
2026-10-09T11:15:04Z ["example.com/archive-first"]
configmap/note patched
Error from server (NotFound): configmaps "note" not foundkubectl reported the ConfigMap deleted, but the next command found it still there, with a deletionTimestamp and the finalizer in place. It would have stayed like that indefinitely. Only when the finalizer was removed did the object disappear.
Back to the moment our three pod records were created. They had no node, and the scheduler gave them one.
08Choosing a node
8.1Filter, score, bind
The scheduler is one more program built on the pattern of this chapter. Its informer watches for pods whose spec.nodeName is empty and queues them. For each, it runs Filter plugins that remove the nodes that can't run the pod, such as nodes without enough unrequested CPU and memory, then Score plugins that rate the rest, and it picks the highest total. Chapter 36 takes that process apart in detail; here we only need its first and last steps.
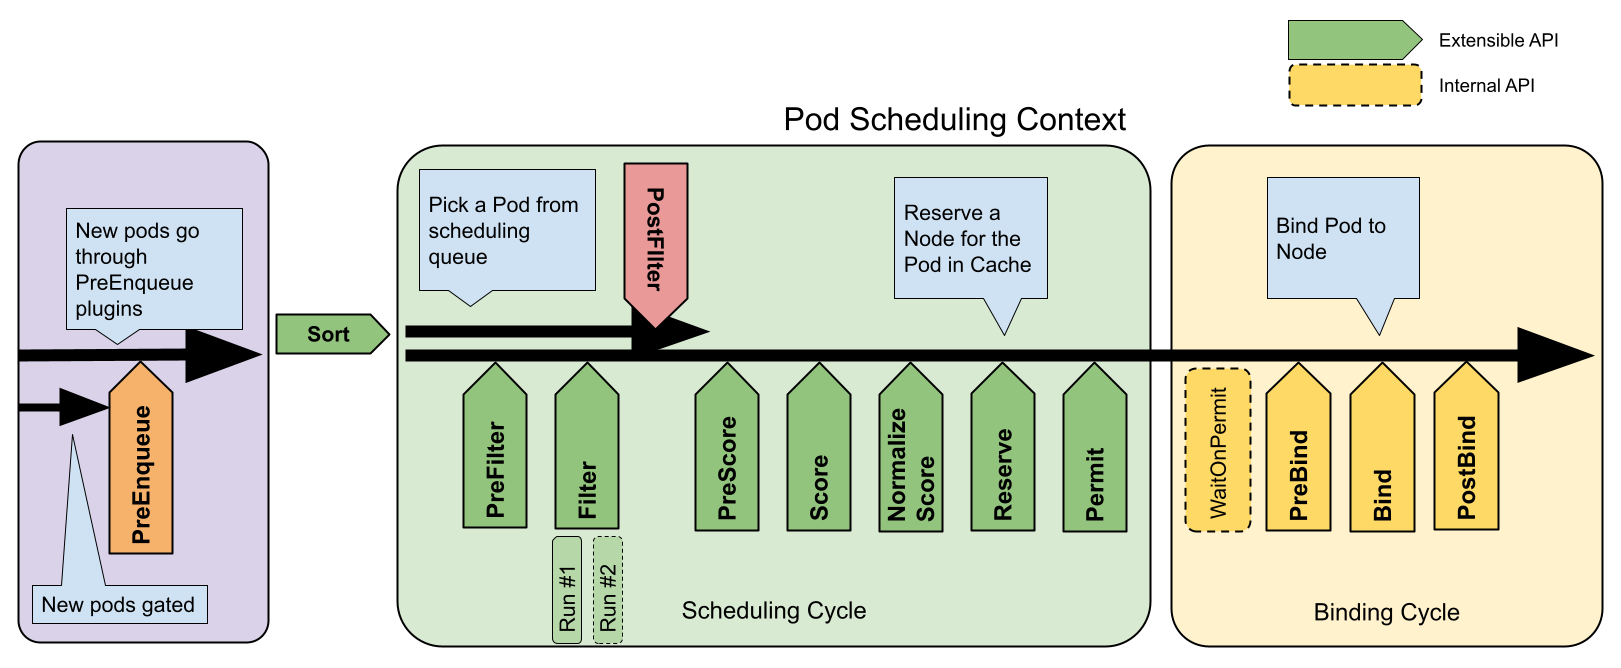
The last step, Bind, is an ordinary API write: a POST to the pod's binding subresource, which sets spec.nodeName. That was the second MODIFIED event for the new pod in section 4.2, and it's the only thing the scheduler does to a pod. It never contacts a node.
Reserve, in the picture, is the scheduler's version of section 5.3's problem. Its cache learns about the bind only when the watch event comes back, and in the meantime the next pod must not be placed into the same free space. So the scheduler records the pod as on that node in its own cache straight away ("assumes" it, in the code's word) and drops the assumption when the bind's watch event confirms it, or when the bind fails.
Once the node name is written, the pod record is waiting for exactly one program: the kubelet on that node.
09The kubelet: from a record to a process
9.1Which pods are mine?
The kubelet is the Kubernetes agent on every node, and it's the only part of the system that starts processes. Its informer watches pods with a field selector, spec.nodeName=kind-worker, so the API server's watch cache sends it only the pods bound to its own node. It can also run static pods from files in a directory on the node; that's how kind and kubeadm start the control plane itself before any API server exists: the etcd-kind-control-plane pod from section 3 is one of them.
For each pod, the kubelet runs a pod worker, and each worker is another reconcile loop. It compares what the pod's spec asks for (these containers, this image, this restart policy) with what's running on the node, and acts on the difference: start what's missing, restart what crashed, stop what's no longer wanted. To act, it needs a way to start containers, and Kubernetes doesn't start them itself.
9.2Talking to the runtime: CRI
Chapter 11 built a container by hand from namespaces, cgroups and a layered root filesystem, and finished with runc, the small program that does those steps for real. Between the kubelet and runc sits a container runtime, usually containerd or CRI-O, which pulls images, unpacks them, and manages containers over their lifetime. The kubelet talks to it through the Container Runtime Interface (CRI), a set of remote procedure calls using gRPC (a framework for calling functions in another process) over a Unix socket on the node, /run/containerd/containerd.sock. Because the interface is fixed, any runtime that implements it works. Docker didn't, and the adapter Kubernetes once carried for it, dockershim, was removed in v1.24.
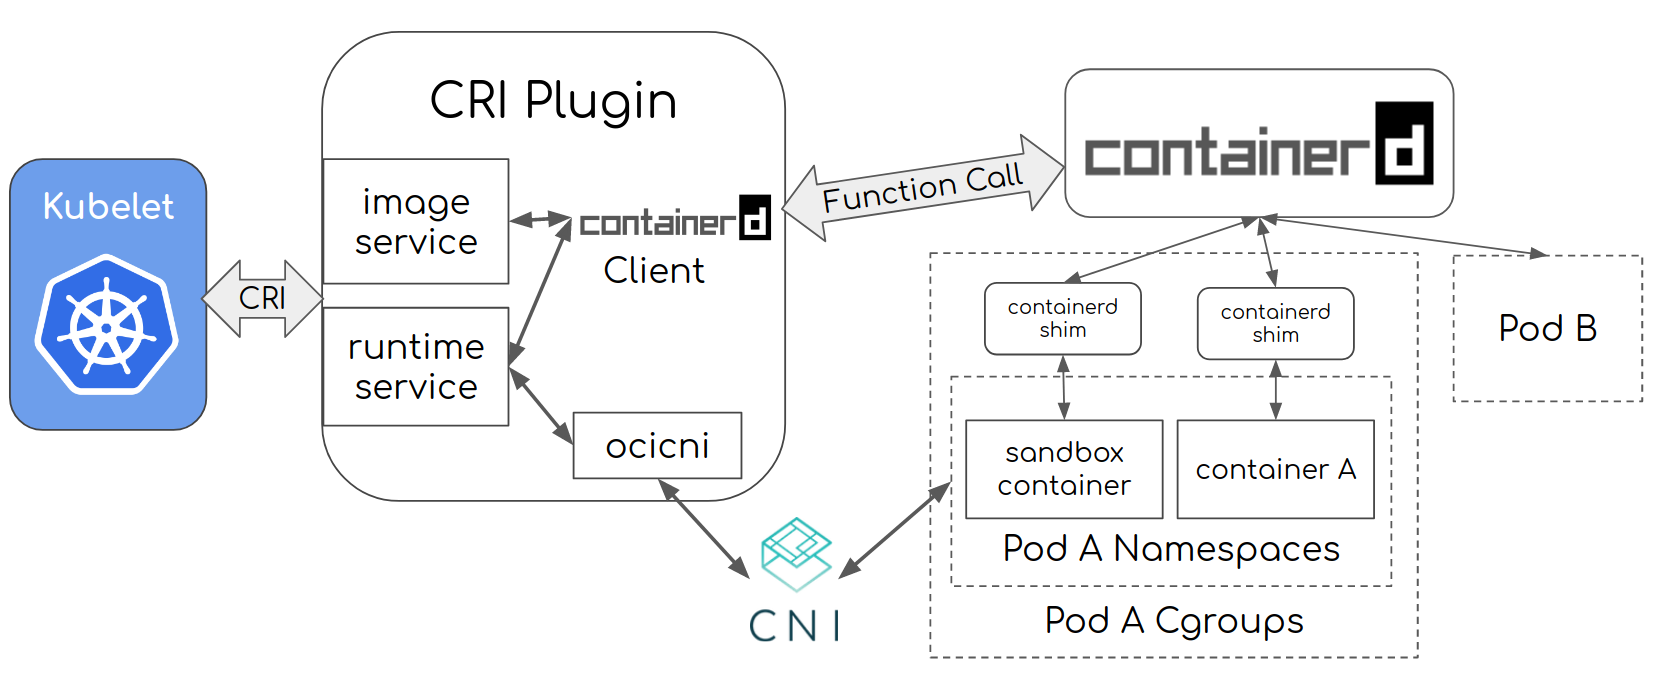
Starting one of our pods takes four calls, in this order, per containerd's description of its CRI plugin:
RunPodSandbox. The runtime creates the pod's network namespace and has a CNI plugin give it an address (section 10). It starts a tiny pause container that does nothing but sleep, so that the pod's namespaces have a process holding them open even while the application containers restart. This sandbox is the "pod" as far as the node is concerned.PullImagefetchesnginx:1.29if the node doesn't have it: the 30 seconds in section 1.CreateContainerprepares the nginx container inside the sandbox's namespaces and cgroup.StartContainerruns it. containerd starts a shim process for the pod,containerd-shim-runc-v2, which calls runc to create each container and then stays behind as its parent, so containerd itself can be restarted or upgraded without killing every container on the node.
crictl is a command-line client for CRI, so it shows what the kubelet sees. This experiment runs it inside the kind-worker node, then lists the node's processes to find the shims, the pause containers and nginx. cut trims the long shim command lines.
docker exec kind-worker crictl pods --label app=web
docker exec kind-worker crictl ps --name nginx
docker exec kind-worker ps -eo pid,ppid,args | grep -E 'containerd-shim|/pause|nginx: master' | grep -v grep | cut -c1-90POD ID CREATED STATE NAME NAMESPACE ATTEMPT RUNTIME
aec3f472cf05f 4 minutes ago Ready web-95c78cc8b-2nxvm default 0 (default)
f131024c4072b 4 minutes ago Ready web-95c78cc8b-8cmxk default 0 (default)
CONTAINER IMAGE CREATED STATE NAME ATTEMPT POD ID POD NAMESPACE
019cf8879fa0b 8524ce6c9242e 3 minutes ago Running nginx 0 aec3f472cf05f web-95c78cc8b-2nxvm default
c4043c9ba5c3b 8524ce6c9242e 3 minutes ago Running nginx 0 f131024c4072b web-95c78cc8b-8cmxk default
298 1 /usr/local/bin/containerd-shim-runc-v2 -namespace k8s.io -id dfff38e25de8d
300 1 /usr/local/bin/containerd-shim-runc-v2 -namespace k8s.io -id 4ddcff9ce3504
347 300 /pause
354 298 /pause
701 1 /usr/local/bin/containerd-shim-runc-v2 -namespace k8s.io -id f131024c4072b
716 1 /usr/local/bin/containerd-shim-runc-v2 -namespace k8s.io -id aec3f472cf05f
753 701 /pause
761 716 /pause
833 701 nginx: master process nginx -g daemon off;
896 716 nginx: master process nginx -g daemon off;The two web pods on this node appear as sandboxes, each with one nginx container inside. In the process list, follow the parent IDs (ppid): shim 701's -id is the sandbox f131024c4072b, and its children are a pause process (753) and nginx (833). Shim 716 is the other pod. Those first two shims, with their own pause processes, are the node's networking pod and kube-proxy pod. Every pod is one shim, one pause process, and its containers.
9.3Noticing what changed: PLEG
The kubelet also has to notice when a container exits by itself, which no API event will tell it. Early versions of the kubelet asked the runtime about every pod from every pod worker, periodically and concurrently. The design proposal that replaced it describes what that did: "Periodic, concurrent, large number of requests causes high CPU usage spikes (even when there is no spec/state change), poor performance, and reliability problems due to overwhelmed container runtime."
The replacement is the PLEG (pod lifecycle event generator). One thread asks the runtime for every container on the node, compares the answer with the previous one, and turns each difference into an event such as "container started" or "container died" for the pod concerned, which wakes only that pod's worker.
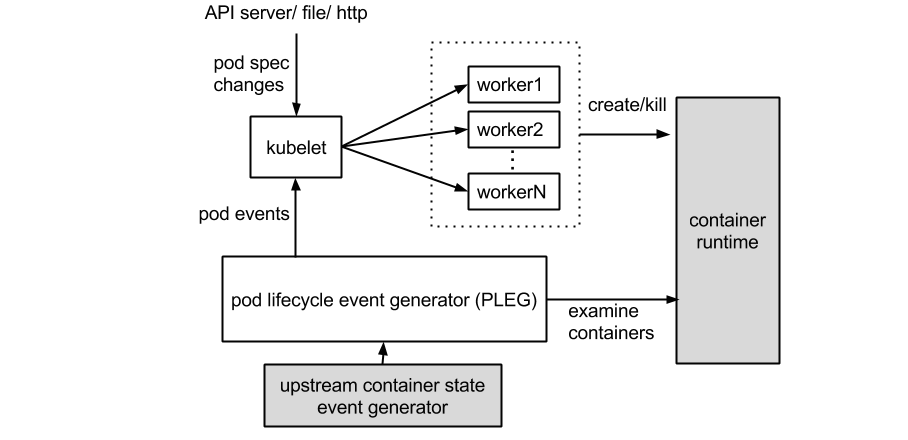
In v1.37 the PLEG relists once a second (genericPlegRelistPeriod in pkg/kubelet/kubelet.go), and the kubelet treats it as a health check: if a relist hasn't completed for 3 minutes, the kubelet reports itself unhealthy with the message "pleg was last seen active … ago; threshold is 3m0s", and the node goes NotReady. That usually means the runtime is answering slowly, because of too many containers, a full or slow disk, or a hung shim. An alternative that has the runtime push container events to the kubelet, called Evented PLEG, has been in alpha since v1.26 and is off by default as of v1.37.
9.4Reporting back: status and heartbeats
Whatever the pod worker finds, it writes into the pod's status through the API server: the container states, readiness, the pod's IP. Those were the ContainerCreating and Running lines in section 4.2, and they're how the ReplicaSet controller and the endpoint controllers learn that a pod is ready.
The kubelet also has to prove the node is alive. It renews a small record called a Lease, one per node in the kube-node-lease namespace, every 10 seconds (a quarter of its 40-second duration), and sends its full node status only when something changes or every 5 minutes. The node lifecycle controller watches those Leases. If a node's Lease goes 50 seconds without renewal (NodeMonitorGracePeriod), it marks the node's Ready condition Unknown and taints the node unreachable. Then the pod tolerations from section 2.2 come into play.
kind-worker loses power. Two web pods were on it. Roughly how long until replacement pods are created on other nodes?
Those defaults favour patience, because a node that's slow to report is far more common than a dead one. The node lifecycle controller also limits itself: by default it evicts from at most one node every 10 seconds, slows down when much of a zone is unhealthy, and evicts nothing if every node seems down, since then the control plane's own connection is the likelier fault.
Our three pods are running and reporting. Each has its own IP address, and clients need one address that reaches all of them.
10Networking: three pods behind one address
10.1An address for every pod: CNI
Kubernetes requires a particular network shape. In the words of its networking overview, each pod "gets its own unique cluster-wide IP address", and all pods "can communicate with each other directly, without the use of proxies or address translation (NAT)". Kubernetes doesn't build that network itself. It leaves it to a CNI plugin.
CNI (Container Network Interface) is a small specification: a plugin is an executable that the container runtime runs with a command, ADD or DEL, the path of the pod's network namespace, and a JSON configuration. On ADD, the plugin creates the pod's network interface inside that namespace, picks an IP address through an IPAM (IP address management) plugin, sets up routes, and prints the result. That's the CNI arrow in the containerd picture above, and it happens inside RunPodSandbox.
kind's network add-on, kindnet, uses two of the standard reference plugins: ptp connects each pod to the node with a virtual Ethernet pair, and host-local hands out addresses from a range given to each node. Section 10.3's experiment lists them on kind-worker. That node's range is 10.244.2.0/24, so its two pods have the addresses 10.244.2.2 and 10.244.2.3, while the pod on kind-worker2 has 10.244.1.2. Larger clusters use plugins such as Calico or Cilium, which also enforce network policies, but the contract with the runtime is the same.
10.2One stable address: Services and EndpointSlices
Pod addresses don't last. A rolling update like the one in section 5.4 replaces every pod, and every replacement gets a new address. Clients shouldn't have to track that.
Our Service from web.yaml gives them something stable. When it was created, the API server allocated it a ClusterIP, a virtual address from a range reserved for Services (10.96.224.205 in our cluster) that belongs to no machine or interface. Then another controller took over. The EndpointSlice controller watches Services and pods, and for each Service writes EndpointSlice records listing the addresses of the ready pods that match its selector. That was the endpointslices key in etcd in section 3.1, and it's rewritten whenever a pod becomes ready or goes away. CoreDNS, the cluster's DNS server, watches Services too, and answers web.default.svc.cluster.local with the ClusterIP.
?Why not just put the three pod addresses in DNS?
The Kubernetes docs give three reasons: DNS software has a long history of ignoring record lifetimes and caching answers after they've expired; some programs look a name up once and keep the answer forever; and even if everyone re-resolved properly, very short lifetimes would put a heavy load on DNS. A ClusterIP never changes, so caching it is harmless, and the choice of pod is made per connection, on the node.
10.3kube-proxy turns Services into rules
Something on each node has to make packets sent to 10.96.224.205:80 arrive at one of the three pods. That's kube-proxy, one more watcher: it runs on every node, watches Services and EndpointSlices, and writes packet-rewriting rules into that node's kernel.
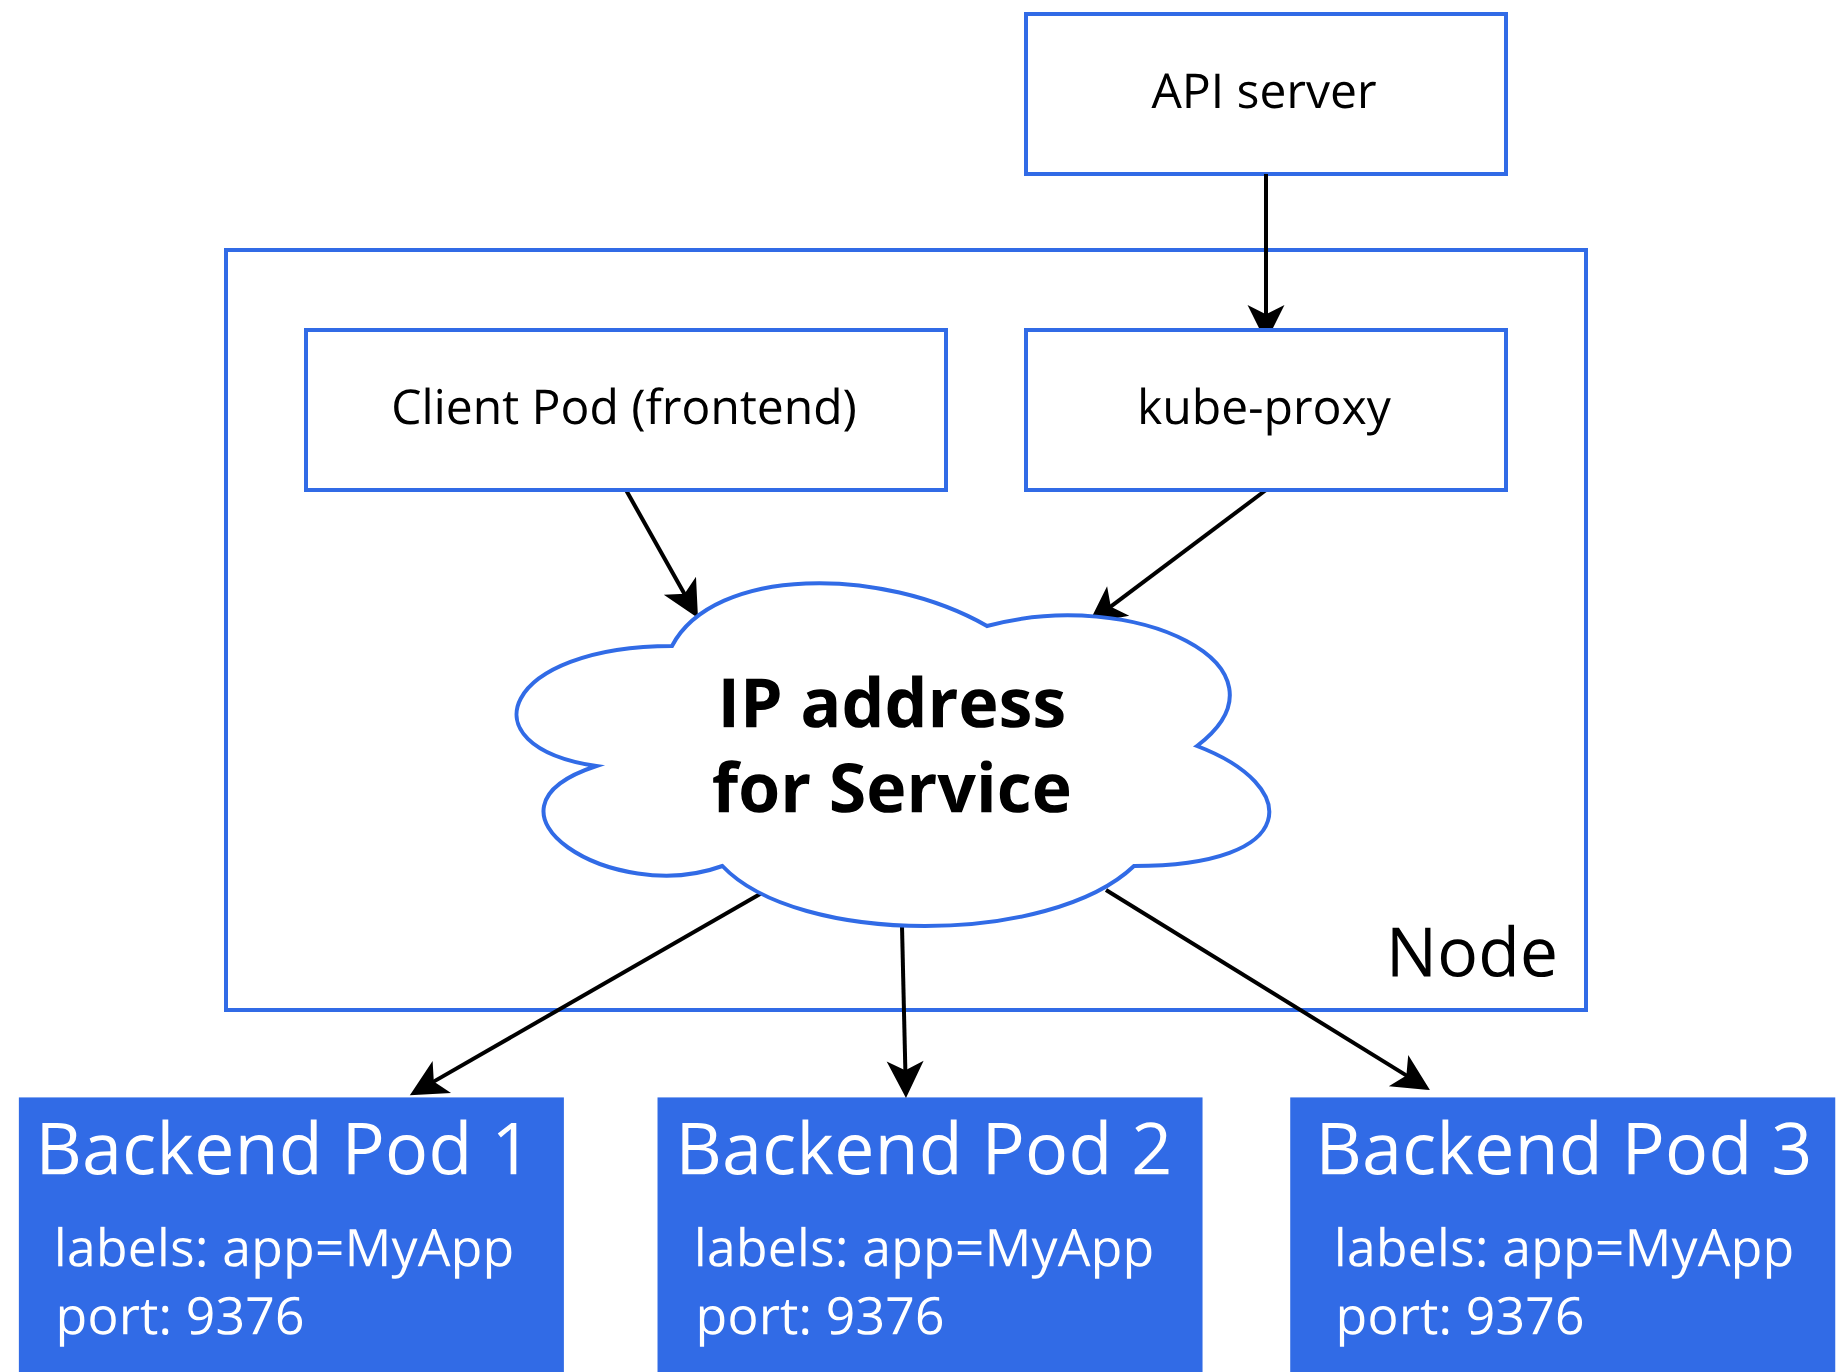
In the default mode those rules are iptables rules. iptables is the interface to netfilter, the Linux kernel's packet-filtering framework, which runs rules at fixed points on every packet's path (chapter 10 follows a packet past them). Rules that kube-proxy writes use DNAT (destination network address translation): they rewrite the packet's destination address from the ClusterIP to a pod's address, and the kernel's connection tracking remembers the choice so every later packet of the same connection, and the replies, are rewritten the same way.
This experiment lists the CNI files on kind-worker, then the Service and its EndpointSlice, then the node's NAT rules that mention default/web. iptables-save -t nat prints the NAT table, the greps keep the rules that matter, and the sed deletes the comment kube-proxy attaches to each rule.
docker exec kind-worker sh -c 'ls /etc/cni/net.d /opt/cni/bin'
kubectl get service web
kubectl get endpointslices -l kubernetes.io/service-name=web
docker exec kind-worker iptables-save -t nat | grep 'default/web' | grep -E 'KUBE-SERVICES|statistic|-j KUBE-SEP|DNAT' | sed -E "s/ -m comment --comment \"[^\"]*\"//"/etc/cni/net.d:
10-kindnet.conflist
/opt/cni/bin:
host-local
loopback
portmap
ptp
NAME TYPE CLUSTER-IP EXTERNAL-IP PORT(S) AGE
web ClusterIP 10.96.224.205 <none> 80/TCP 4m20s
NAME ADDRESSTYPE PORTS ENDPOINTS AGE
web-mpv42 IPv4 80 10.244.1.2,10.244.2.3,10.244.2.2 4m20s
-A KUBE-SEP-7QE66YRUUVCO6FRM -p tcp -m tcp -j DNAT --to-destination 10.244.2.3:80
-A KUBE-SEP-MQ4W7Q2CV67URU6Q -p tcp -m tcp -j DNAT --to-destination 10.244.1.2:80
-A KUBE-SEP-QHWUG6SOC7OJ2BZK -p tcp -m tcp -j DNAT --to-destination 10.244.2.2:80
-A KUBE-SERVICES -d 10.96.224.205/32 -p tcp -m tcp --dport 80 -j KUBE-SVC-LOLE4ISW44XBNF3G
-A KUBE-SVC-LOLE4ISW44XBNF3G -m statistic --mode random --probability 0.33333333349 -j KUBE-SEP-MQ4W7Q2CV67URU6Q
-A KUBE-SVC-LOLE4ISW44XBNF3G -m statistic --mode random --probability 0.50000000000 -j KUBE-SEP-QHWUG6SOC7OJ2BZK
-A KUBE-SVC-LOLE4ISW44XBNF3G -j KUBE-SEP-7QE66YRUUVCO6FRMRead the rules from the middle. A packet heading for the ClusterIP on port 80 matches the KUBE-SERVICES rule and jumps to the Service's own chain, KUBE-SVC-…. That chain picks a backend with three rules tried in order. Rule one jumps to the pod 10.244.1.2 with probability 1/3. If it didn't, the second jumps to 10.244.2.2 with probability 1/2: half of the remaining 2/3, another third. Otherwise the last rule always jumps to 10.244.2.3, the final third. Each KUBE-SEP-… chain (a service endpoint) does the DNAT to one pod. These are the same three addresses as the EndpointSlice line, and when a pod is replaced, kube-proxy rewrites them.
10.4iptables, nftables, IPVS and eBPF
Those rules have a cost that grows with the cluster. kube-proxy writes a few rules per Service and a few per endpoint, and every node holds the rules for every Service. The kube-proxy reference warns that in clusters with tens of thousands of pods and Services this "means tens of thousands of iptables rules, and kube-proxy may take a long time to update the rules in the kernel when Services (or their EndpointSlices) change." There are four ways to run it, as of the v1.37 docs (October 2026):
| Mode | How it picks a backend | Status |
|---|---|---|
| iptables | Chains of rules, tried in order, as above | The default on Linux; the docs say a future version will change the default to nftables |
| nftables | The kernel's newer packet-filtering API, with lookups instead of long chains | Needs kernel 5.13 or later; faster to update and, at tens of thousands of Services, faster per packet |
| IPVS | The kernel's built-in load balancer, using hash tables | Deprecated since v1.35; to be disabled by default from v1.40 and removed in v1.43 |
| eBPF, without kube-proxy | Programs loaded into the kernel look the Service up in a hash map, at the socket or as the packet arrives | Provided by CNI plugins such as Cilium, which replace kube-proxy entirely |
The last row is where many large clusters have gone. Chapter 48 explains how eBPF programs run safely inside the kernel and why a hash lookup costs the same with ten Services or ten thousand.
Our web service is now complete: three pods, one address, rules on every node. Everything so far assumed the control plane keeps up with the writes. In a big cluster that assumption is the first to fail.
11When the control plane falls behind
11.1Expensive requests
Not every request costs the same. Reading one pod is cheap. Listing all 150,000 pods of a large cluster means gathering about half a gigabyte of objects (150,000 × 3.4 KB) and well over a gigabyte once encoded as JSON, roughly 8 KB per pod for our small nginx pods. All of it is held in memory while the response is built and sent, so a few such requests at once can run an API server out of memory.
Lists can be made cheaper. A client can ask for pages with limit and a continue token, and the API server answers from its watch cache when it can instead of going to etcd. Informers can also start with a streaming list (the API server has offered it by default since v1.34): a watch that first sends the current objects one at a time and then a bookmark, so no giant response is ever built. But the cheapest list is the one that never happens, and that depends on watches staying connected.
11.2The thundering herd after a restart
Consider what happens when an API server restarts, say during an upgrade. Every watch connected to it breaks at once: one from each kubelet, several from each kube-proxy, and dozens from the controller manager and scheduler. All of them reconnect. Those whose last resourceVersion is still in the new server's watch cache resume cheaply. Those whose position has fallen out of the window get 410 Gone and list again, all at the same moment. This is a thundering herd: many clients waking at once to do expensive work, each making the others slower.
Failures can feed each other in a loop, and the API Priority and Fairness docs describe one. The controller manager and scheduler run as several copies, and one copy at a time is the active leader, holding a Lease it must keep renewing. If the API server is too slow to answer a renewal, the leader loses its Lease, "failures in leader election cause their controllers to fail and restart, which in turn causes more expensive traffic as the new controllers sync their informers."
The defences are on both sides of the loop. Clients back off when requests fail and stagger their retries; client-go does this by default. The node lifecycle controller stops evicting when it sees most nodes failing at once, as section 9.4 described. And the API server protects itself by deciding which requests get served first.
11.3API Priority and Fairness
The API server limits how many requests it works on at once: by default 400 reads and 200 writes (--max-requests-inflight and --max-mutating-requests-inflight), 600 in total. API Priority and Fairness (APF), on by default and stable since v1.29, decides how those 600 places, which it calls seats, are shared. It works like this:
- Each request is matched by a FlowSchema to a priority level. Each priority level gets its own share of the seats, so a flood at one level can't take seats from another.
- Within a level, requests are grouped into flows, usually one per user or per namespace, and queued. A fair queuing algorithm takes turns between flows, so one misbehaving client can't starve the rest of its level. Flows are assigned to queues by shuffle sharding: each flow gets a few queues chosen by hashing its name, and joins the shortest, which makes it very unlikely that a light flow shares all its queues with a heavy one.
- An expensive request takes more than one seat. A list that the server estimates will return many objects takes seats in proportion, and a write occupies extra seats for a while to pay for the watch notifications it causes.
- When a level's queues are full, new requests are rejected with HTTP 429 Too Many Requests, and well-behaved clients back off and retry.
This experiment shows the default levels, the number of seats each one gets, and which FlowSchema sends which requests where. Seat numbers come from the API server's own metrics, which kubectl get --raw /metrics fetches.
kubectl get prioritylevelconfigurations
kubectl get --raw /metrics | grep '^apiserver_flowcontrol_nominal_limit_seats'
kubectl get flowschemas -o custom-columns=NAME:.metadata.name,LEVEL:.spec.priorityLevelConfiguration.name,PRECEDENCE:.spec.matchingPrecedenceNAME TYPE NOMINALCONCURRENCYSHARES QUEUES HANDSIZE QUEUELENGTHLIMIT AGE
catch-all Limited 5 <none> <none> <none> 5m19s
exempt Exempt <none> <none> <none> <none> 5m19s
global-default Limited 20 128 6 50 5m19s
leader-election Limited 10 16 4 50 5m19s
node-high Limited 40 64 6 50 5m19s
system Limited 30 64 6 50 5m19s
workload-high Limited 40 128 6 50 5m19s
workload-low Limited 100 128 6 50 5m19s
apiserver_flowcontrol_nominal_limit_seats{priority_level="catch-all"} 13
apiserver_flowcontrol_nominal_limit_seats{priority_level="exempt"} 0
apiserver_flowcontrol_nominal_limit_seats{priority_level="global-default"} 49
apiserver_flowcontrol_nominal_limit_seats{priority_level="leader-election"} 25
apiserver_flowcontrol_nominal_limit_seats{priority_level="node-high"} 98
apiserver_flowcontrol_nominal_limit_seats{priority_level="system"} 74
apiserver_flowcontrol_nominal_limit_seats{priority_level="workload-high"} 98
apiserver_flowcontrol_nominal_limit_seats{priority_level="workload-low"} 245
NAME LEVEL PRECEDENCE
catch-all catch-all 10000
exempt exempt 1
global-default global-default 9900
kube-controller-manager workload-high 800
kube-scheduler workload-high 800
kube-system-service-accounts workload-high 900
probes exempt 2
service-accounts workload-low 9000
system-leader-election leader-election 100
system-node-high node-high 400
system-nodes system 500Shares of the limited levels add up to 245 (5 + 20 + 10 + 40 + 30 + 40 + 100), and each level gets that fraction of the 600 seats, rounded up. workload-low, with 100 of the 245 shares, gets 600 × 100 ÷ 245 ≈ 245 seats, and leader-election, with 10, gets roughly 25. Read down the FlowSchemas, lowest precedence number first, to see where our story's programs land. Leader election (which section 11.2 showed was dangerous to lose) has its own level, so it never waits behind anything else. Kubelets' heartbeats go to node-high. The controller manager and scheduler go to workload-high. Controllers you install in pods use service accounts and land in workload-low, and kubectl from an ordinary user lands in global-default. exempt requests, from cluster administrators and health probes, bypass the limits entirely, so an administrator can still act during an overload.
Levels can lend unused seats to busy ones and borrow them back, within limits each level sets, so a quiet cluster doesn't waste capacity.
11.4When etcd is the bottleneck
Behind every write, etcd must agree with its peers and flush the entry to disk before answering, so its speed is set by disk flush latency and the round trip between members. A disk shared with noisy neighbours, a slow cloud volume, or CPU starvation that delays Raft heartbeats all show up as slow API writes; chapter 27 lists the etcd metrics for each. For the size limit from section 3.3, the Kubernetes guide for large clusters suggests keeping Event objects, which are numerous, short-lived and constantly written, in a separate etcd cluster of their own.
12How big a cluster can get
12.1The supported envelope
The Kubernetes documentation states the size it's designed for. As of the v1.37 docs (Considerations for large clusters, October 2026), a cluster should meet all of these at once:
| Limit | Value |
|---|---|
| Pods per node | at most 110 |
| Nodes | at most 5,000 |
| Pods in total | at most 150,000 |
| Containers in total | at most 300,000 |
These aren't hard limits that the code enforces. They're the envelope that Kubernetes' scalability group tests against, measured by service-level objectives such as these, from the SIG Scalability SLO list: 99% of writes to single objects finish within 1 second; 99% of reads of one object within 1 second, and of lists within 30 seconds; and 99% of stateless pods are started and observed running within 5 seconds of creation, not counting image pulls. Clusters beyond the envelope exist, but they rely on tuning, and the SLOs are no longer promised.
12.2Working out the load
This chapter's numbers are enough to see why the limits sit where they do. Node heartbeats alone, at one Lease renewal per node every 10 seconds, are a steady stream of writes. Pod records, at about 3.4 KB each for a small pod (section 3.1), are a significant share of etcd's suggested maximum, before counting the old revisions that each status update leaves behind until the next compaction.
| Lease renewals | 5,000 nodes ÷ 10 s | 500 writes/s |
| Pod records in etcd | 150,000 × 3.4 KB | ≈ 510 MB |
| Share of the suggested 8 GiB maximum | 510 MB ÷ 8.6 GB | ≈ 6% |
| One full list of all pods as JSON | 150,000 × ~8 KB | ≈ 1.2 GB |
| steady load per second, and the size of one careless request | 500 writes/s · 1.2 GB | |
Real pods are probably larger than our minimal nginx pod, with environment variables, volumes and sidecar containers, so treat the last three lines as lower bounds. Steady load like this is manageable. What breaks big clusters is bursts: a relist storm after a restart, an operator that lists every pod every minute, a rollout that rewrites thousands of pods at once.
13Operating it
13.1Where to look
Each question this chapter raised has a command that answers it on a running cluster.
# Who did what, in order? (section 1)
kubectl get events --sort-by=.metadata.resourceVersion
kubectl describe deploy web            # conditions, ReplicaSets, recent events

# Why was my request refused? (section 2)
kubectl auth can-i create deployments --as=system:serviceaccount:shop:builder
kubectl apply -f web.yaml --dry-run=server    # admission and validation, without storing

# How big is etcd, and is it near its quota? (section 3)
etcdctl endpoint status -w table
etcdctl alarm list                     # NOSPACE means the cluster is read-only

# Who owns this object, and what's holding up its deletion? (section 7)
kubectl get pod POD -o jsonpath='{.metadata.ownerReferences}{"\n"}{.metadata.finalizers}{"\n"}'

# What does the runtime see on this node? Is the PLEG healthy? (section 9)
crictl pods; crictl ps -a
journalctl -u kubelet | grep -i pleg

# Which pods are behind this Service, and what rules did kube-proxy write? (section 10)
kubectl get endpointslices -l kubernetes.io/service-name=web
iptables-save -t nat | grep 'default/web'

# Is the API server rejecting or queueing requests? (section 11)
kubectl get --raw /metrics | grep -E 'apiserver_flowcontrol_(rejected_requests_total|current_inqueue_requests)'13.2Rules that hold up
- Describe the end state, and let controllers find the steps. Apply manifests; don't script sequences of imperative commands.
- Write controllers that compare levels. Recompute what's missing from the current state on every pass, and make every pass safe to repeat.
- Use patch or apply, never replace a stale copy. Let resourceVersion conflicts tell you about the other writer.
- Don't strip finalizers to unstick a delete until you know which controller owns them and why it hasn't finished.
- Keep etcd small. No large blobs in ConfigMaps, Secrets or custom objects; consider a separate etcd for Events in big clusters.
- Watch, don't poll; page your lists. A controller that lists everything on a timer is a load test you didn't schedule.
- Pin kube-proxy's mode in its configuration so an upgrade can't change it.
13.3What you trade for what
| You get | You pay | When the bill arrives |
|---|---|---|
| Self-healing from level-triggered controllers | Changes take effect in several steps, seconds apart | When you expect kubectl apply returning to mean "running" |
| One API server enforcing every rule | Every component depends on it and on etcd | During a control-plane outage, when nothing can change |
| Watches instead of polling | Long-lived connections that all break together | After an API server restart, as a relist storm |
| Optimistic concurrency, no locks | Writers must handle 409 and retry | In scripts that replace whole objects |
| Finalizers for safe cleanup | Objects can be stuck Terminating | When the controller behind a finalizer is gone |
| A five-minute grace before evicting pods from a lost node | Slow failover for dead nodes | When a node dies and its pods take six minutes to come back |
13.4Symptom, cause, fix
| Symptom | Likely cause | Fix |
|---|---|---|
| Pods Pending, nothing scheduled | Scheduler not running, or no node passes Filter | Read the pod's FailedScheduling event (chapter 36) |
| Deployment updated, pods unchanged | Controller manager down or not the leader | Check its pod and leader-election Lease in kube-system |
| Object stuck in Terminating | A finalizer whose controller is gone or failing | Find the finalizer's owner; fix it, then let it finish |
409 Conflict in automation | Replacing a stale copy | Use patch or server-side apply; retry from a fresh read |
Controllers relisting constantly, 410 Gone in logs | Watches falling out of the cache window, often after restarts | Enable bookmarks (client-go does); reduce API server restarts |
| Node NotReady, "pleg was last seen active" | Container runtime answering slowly | Check runtime health, disk, number of containers on the node |
| Pods on a dead node still listed for minutes | Expected: 50 s grace plus the 300 s toleration | Lower tolerationSeconds for pods that must fail over faster |
429 Too Many Requests from the API server | A priority level's queues are full | Find the flow in APF metrics; fix the client or give it its own level |
Writes rejected cluster-wide, NOSPACE alarm | etcd past its space quota | Delete data, compact, defragment, then etcdctl alarm disarm |
| Service traffic goes to a pod that's gone | kube-proxy rules not yet updated, slow syncs | Check kube-proxy sync metrics; consider nftables or eBPF at scale |
14Summary
kubectl applywrites one record and exits. Everything after that is separate programs each noticing a change and writing another record: Deployment, ReplicaSet, pods, a node name, container status.- Every read and write passes through the API server, which authenticates, authorizes, admits, validates and defaults it. Nothing else talks to etcd.
- etcd stamps every write with a cluster-wide revision, and that number is each record's resourceVersion. It keeps old versions until compaction, and stops accepting writes past its space quota (2 GiB by default, 8 GiB suggested maximum).
- Programs learn about changes by watching from a resourceVersion. A list gives the state at revision n, a watch streams every change after it, and a watch that falls too far behind gets 410 Gone and lists again.
- Informers keep a local cache and feed a work queue of names, so reads are local, and many events for one object become one piece of work.
- Controllers compare levels, not edges. They recompute what's missing from the whole current state, which survives missed events, restarts and merged changes; expectations stop a stale cache from causing duplicates.
- resourceVersion turns every update into a compare-and-swap. A stale write gets 409 Conflict; patches and server-side apply avoid most conflicts and name the field's owner.
- Owner references by UID drive garbage collection, and finalizers let a delete wait until a controller has cleaned up what the object stood for.
- The kubelet reconciles pods on its node through CRI: a sandbox with a pause container and a CNI address, then image pull and containers under a per-pod shim. The PLEG notices changes by relisting every second, and Lease renewals every 10 seconds prove the node is alive.
- A Service is a virtual IP that kube-proxy turns into rules on every node, choosing a backend per connection; iptables chains grow with the cluster, and nftables or eBPF scale further.
- The control plane fails by overload first, through expensive lists and relist storms; API Priority and Fairness shares 600 seats among priority levels so heartbeats and leader election still get through, within a tested envelope of 5,000 nodes and 150,000 pods.
15Build this
Turn the controllers off, then write your own.
- On the kind cluster, stop the controller manager by moving its static pod file out of the way:
docker exec kind-control-plane mv /etc/kubernetes/manifests/kube-controller-manager.yaml /root/. Delete onewebpod and scale the Deployment to 5. Watch withkubectl get pods -wand see that nothing happens: the records change and nobody acts on them. - Move the file back. Within seconds the controller manager starts, lists everything, and makes the cluster match the spec in one pass, without having seen any of the events it missed.
- Then write a controller of your own in roughly forty lines of Python. Use the
kubernetesclient package'swatch.Watch().stream()on ConfigMaps labelledreplicas-of=NAME, and on every event, read the ConfigMap'scountfield and create or delete plain pods labelledowner=NAMEuntil the count matches. Put an owner reference on each pod pointing at the ConfigMap by UID. - Break it on purpose: kill your controller, delete pods, change the count twice, start it again. If it's level-triggered, it ends in the right state. Then delete the ConfigMap and watch the garbage collector remove your pods.
16Interview questions
beginnerWhat happens between kubectl apply and a running pod?›
kubectl sends the Deployment to the API server, which authenticates, authorizes, admits and validates it and stores it in etcd. Then a chain of watchers takes over. The Deployment controller creates a ReplicaSet; the ReplicaSet controller creates the pod records; the scheduler picks a node for each pod and writes it into the record; the kubelet on that node sees a pod assigned to it and asks the container runtime, through CRI, to create a sandbox with a network address from the CNI plugin, pull the image, and start the containers. The kubelet then writes the pod's status back.
None of these programs calls another. Each one watches records through the API server and writes records back, so the pod exists because each of them independently noticed a gap between what was wanted and what existed.
intermediateWhat does level-triggered mean for a Kubernetes controller, and why does it matter?›
A level-triggered controller uses an event only as a reason to look. It compares the whole desired state, such as replicas: 3, with the whole observed state, the pods it can find, and acts on the difference. An edge-triggered one acts on what the event says changed, such as "a pod was deleted, create one".
Events get lost: the controller restarts, a watch expires and is replaced by a fresh list from which deleted objects are missing, or several updates arrive as one. An edge-triggered controller then drifts from the goal forever. A level-triggered one is correct after its next pass. It still has to cope with its own cache lagging behind its writes, which the ReplicaSet controller does with expectations, and since 1.36 by waiting until its cache has reached the resourceVersion of its last write.
intermediateTwo processes update the same Deployment at the same time. What stops one from losing the other's change?›
Optimistic concurrency on resourceVersion. Every object carries the etcd revision of its last write. An update sends the version the client read, and the API server turns it into an etcd transaction that stores the new value only if the key's revision is unchanged. If someone else wrote in between, the client gets 409 Conflict and must re-read and reapply its change.
Patches reduce conflicts by changing only named fields, and server-side apply records which manager owns each field and reports a conflict if you try to set one that someone else owns. Status is written through a separate subresource, so controllers updating status and users editing the spec don't fight.
deepAn object has been stuck in Terminating for an hour. Walk through what's going on.›
Deleting an object that has finalizers doesn't remove it. The API server sets deletionTimestamp and waits until every key in metadata.finalizers has been removed by the controller responsible for it, after that controller finishes its cleanup. Stuck in Terminating means at least one finalizer is still there.
Look at the finalizers and work out who owns each one. Common causes: the controller was uninstalled; it's crashing; it can't reach an external system, such as a cloud API to delete a load balancer; or, with foreground deletion, a dependent with blockOwnerDeletion is itself stuck. Fix the controller and let it finish. Removing the finalizer by hand makes the record go away but leaves whatever it represented, the disk or the load balancer, behind with nothing tracking it.
deepYour 3,000-node cluster's API servers fall over every time one of them restarts. Why, and what do you do?›
A restart breaks every watch connected to that server at once. Clients reconnect together, and those whose last resourceVersion has fallen out of the new server's watch cache get 410 Gone and relist. Full lists are the most expensive requests the server handles, so a few thousand at once exhaust memory and push latency up. Slow responses then make leader-election Lease renewals time out, controllers restart and relist again, and kubelet Lease renewals arrive late enough for nodes to be marked unreachable, which adds more writes.
Mitigations: make sure clients use watch bookmarks and streaming lists, so they resume instead of relisting; check API Priority and Fairness so leader election and node heartbeats have protected seats, and give heavy controllers their own priority level; find any client that lists without paging or polls; roll API servers one at a time with time to warm their caches; and keep etcd on fast dedicated disks. If the cluster's needs keep growing, split it into several smaller clusters.
17Go deeper
Your Deployment's resourceVersion is 783 and a pod's is 900. What can you conclude?›
Nothing about their order. resourceVersions are positions in one etcd history, but the API only guarantees they can be compared between objects of the same kind. Two pods, or two Deployments, can be compared; a Deployment and a pod can't.
kubectl delete printed 'deleted', but kubectl get still shows the object. How?›
The object has a finalizer. The delete set its deletionTimestamp and returned; the object remains, Terminating, until every finalizer key has been removed by the controller that owns it.
A node loses power. Why are its pods still listed as Running for several minutes?›
The control plane only sees the node's Lease stop being renewed. After 50 seconds the node is marked unreachable and tainted, and the pods tolerate that taint for 300 seconds before they're evicted and replaced.
Why does the ReplicaSet controller need 'expectations' if it's level-triggered?›
Its cache lags behind its own writes. Right after creating three pods, the cache can still show zero, and a second pass would create three more. Expectations record the creates in flight until their watch events arrive.
Burns, Grant, Oppenheimer, Brewer and Wilkes on what a decade of Google's cluster managers taught them: the API server as the only door to the store, reconciliation loops, labels and ownership. Short and readable.
The reference for list, watch, resourceVersion semantics, bookmarks, streaming lists and conflicts, on kubernetes.io. Section 4 of this chapter is a guided tour of its first half.
The short list of rules every controller author should know: one item at a time, level driven not edge driven, use shared informers, wait for caches, never mutate the cache.
A complete controller in Go built on client-go informers and a work queue, the shape every operator copies.
The kubernetes.io page on priority levels, flows, seats and shuffle sharding, with the defaults and the metrics to watch.
How MVCC revisions, compaction, defragmentation and the space quota work, from the etcd documentation.
Why the kubelet stopped polling each pod and started relisting the whole node, in the Kubernetes design-proposals archive.
18Related chapters
The namespaces, cgroups and runc underneath every pod sandbox and container the kubelet starts. Chapter 11.
How etcd's members agree on each write, what a slow disk does to them, and the metrics that show it. Chapter 27.
Requests, limits, QoS, and the scheduler's Filter and Score plugins in detail. Chapter 36.
The kernel mechanism Cilium uses to replace kube-proxy's iptables rules with hash-map lookups. Chapter 48.
Netfilter, connection tracking and NAT, the machinery kube-proxy's rules run in. Chapter 10.
Retries with backoff and load shedding, the client-side half of surviving an overloaded API server. Chapter 40.