You run a small service called w3. Every 100 milliseconds it sends a tiny "I'm still here" message to a second program, the monitor, whose only job is to watch it. These messages are called heartbeats. One afternoon the heartbeats stop arriving. What should the monitor conclude?
The tempting answer is that w3 has crashed. But the monitor hasn't seen w3 crash. All it has seen is that nothing arrived, and plenty of healthy situations look exactly the same: w3 might be frozen for a moment while its runtime tidies up memory, the network between the two might have dropped some packets, or the monitor itself might have stalled and not been listening. From where the monitor sits, a dead server and a slow one produce the same silence.
Every group of servers that cooperate, a cluster, has to make this call about its members many times a second, because the answer decides who takes over the work. The part of the system that makes the call is the failure detector. This chapter follows w3 and asks one question: when all you can go on is silence, how do you decide a server is gone, and what keeps a wrong decision from doing damage? We'll start by watching a monitor get exactly this wrong, and each fix along the way will lead to the next problem, ending with two servers that both believe they're in charge.
01Watching w3 go quiet
1.1The simplest monitor
The simplest monitor has one rule: if no heartbeat has arrived for a set length of time, the timeout, declare the worker dead. We'll use 300 milliseconds, which is three missed heartbeats' worth.
To see what that rule does, we need a worker that is alive but occasionally stops. Many programs, Java and Go services among them, manage memory with a garbage collector, a piece of the runtime that every so often freezes the whole program while it cleans up. A long freeze like that is a GC pause, and they can last seconds. A stalled disk can freeze a process in the same way. The script below imitates one: the worker sends a heartbeat every 100 ms, and one second in, it sleeps for a full second. A monitor running in a second thread (a second line of execution inside the same program) applies the 300 ms rule every 20 ms.
The worker pauses for exactly 1 second, then carries on. The monitor's timeout is 300 ms. What will the monitor say?
import threading, time

last_beat = time.monotonic()
start = time.monotonic()
stop = False

def say(msg): print(f"  t={time.monotonic() - start:4.1f}s  {msg}", flush=True)

def worker():                                  # a healthy service that sends a heartbeat every 100 ms
    global last_beat
    while not stop:
        last_beat = time.monotonic()
        time.sleep(0.1)
        if 1.0 <= time.monotonic() - start < 1.05:
            say("worker: entering a 1.0 s pause (a long GC, a stalled disk)")
            time.sleep(1.0)
            say("worker: pause over, still alive")

def monitor(timeout=0.3):                      # declares the worker dead after 300 ms of silence
    dead = False
    while not stop:
        silent = time.monotonic() - last_beat
        if silent > timeout and not dead:
            say(f"monitor: no heartbeat for {silent:.1f}s -> declares the worker DEAD"); dead = True
        elif silent <= timeout and dead:
            say("monitor: heartbeat is back -> the worker was never dead"); dead = False
        time.sleep(0.02)

threading.Thread(target=worker, daemon=True).start()
threading.Thread(target=monitor, daemon=True).start()
time.sleep(3)
stop = True t= 1.0s worker: entering a 1.0 s pause (a long GC, a stalled disk)
t= 1.3s monitor: no heartbeat for 0.3s -> declares the worker DEAD
t= 2.0s worker: pause over, still alive
t= 2.1s monitor: heartbeat is back -> the worker was never deadRead the four lines in order. The pause starts at 1.0 s. The monitor gives its verdict at 1.3 s, exactly one timeout later, and the verdict is wrong: the worker wakes at 2.0 s fully alive, and the monitor takes the verdict back a moment later when the first heartbeat arrives. Run it again and the timestamps shift a little, because they depend on how the operating system schedules the threads. A second run can declare the worker dead at 1.2 s instead of 1.3 s.
Here is the same run from the monitor's side, with the worker's name in place and a failover added, because that's what a real monitor would do next:
w3 sends a heartbeat every 100 ms, and each one reaches the monitor long before its silence timer gets near 300 ms. The verdict is alive.1.2What went wrong
Nothing was broken. The monitor followed its rule exactly, and the rule can't tell a worker that has died from one that has stopped for a moment. A verdict of "dead" about a worker that is alive is called a false positive. If the monitor had also promoted a replacement, as in the last frames above, we'd now have two workers doing one job. If w3's job was to be the leader, the one server allowed to accept writes, we'd now have two leaders, each taking writes the other knows nothing about.
Raising the timeout to a full second would have saved this particular run. It would also mean that a real crash takes a full second to notice, with the service down the whole time, so no value is right for everyone. Before looking for a better value, we should ask whether any rule could do better. Could a cleverer monitor look at the silence and tell which kind it is?
02Why silence can't be explained
On one machine, a crashed process is a fact: the kernel notices and tells the process's parent. Across a network there is no such signal. All a monitor ever has is messages that did or didn't arrive. From here on, a node is any member of the cluster, whether a whole server or one process on it, so w3 is a node.
2.1Four failures that look identical
Suppose the monitor hears nothing from w3. Here are the four things that could have happened, and what the monitor sees in each:
| What happened | What the observer sees |
|---|---|
| The process crashed | No replies |
| The machine is up but the process is paused (a GC pause, memory being swapped out to disk, a stuck disk) | No replies, then a burst of late ones |
| The network between you dropped or delayed packets | No replies, while others may hear it fine |
| Your own process was paused, and the peer is fine | No replies arrived while you weren't looking |
In the table, "you" are the monitor and the peer is the node it's watching, w3. The last row is the one that bites. A monitor that is itself frozen for three seconds will wake up, see three seconds of silence from everyone, and conclude that the whole cluster died.
?Why can't a smarter protocol tell them apart?
Because in an asynchronous network, one where a message can be delayed by any amount, a slow process and a crashed one produce exactly the same observations. Fischer, Lynch and Paterson proved a famous consequence in 1985, known as the FLP result. No deterministic protocol (one that makes no random choices) can guarantee consensus, meaning getting several nodes to agree on one value such as "who is the leader" (chapter 27 builds it), if even one process may crash. The reason is the one we've just seen: the protocol can never be sure whether to keep waiting for the silent node or to go on without it.
So real systems give up on certainty and add timing assumptions. Chandra and Toueg's unreliable failure detectors (1996) formalised the trade by naming two properties a detector can have:
- Completeness: every crashed process is eventually suspected.
- Accuracy: correct processes, the ones that haven't crashed, aren't suspected (or eventually stop being suspected).
Completeness is easy to get: suspect everyone who is quiet. Accuracy is the hard part, and every design in this chapter is a way of buying more of it.
2.2Gray failure: alive to one observer, dead to another
The table above treats a node as either up or down, but real failures are often partial. w3 might answer the monitor's health checks while timing out on every real request, or it might reach the monitor but not the other servers it works with. Huang et al. call this gray failure (HotOS 2017): the failure detector and the application disagree about whether a component is healthy.
The network fails partially too. When it splits so that some machines can reach each other but not the rest, that's a network partition. Bailis and Kingsbury's The Network is Reliable (ACM Queue, 2014) collects public postmortems of partitions that cut off only some machines, links that carried traffic in one direction but not the other, and switches that dropped some traffic and not other traffic. It's the best argument against assuming failures are clean.
No detector can be certain, then, and some will be wrong in both directions. The practical question is how to be wrong rarely and cheaply, and the first tool is the one our monitor already used: a timeout. We need to see what choosing its length costs.
03Heartbeats and timeouts
3.1The trade you can't avoid
w3's monitor uses the basic detector. Each node sends a heartbeat every interval, which we'll call Δ (100 ms for w3). The monitor declares a node failed if nothing arrives for a timeout T (300 ms for us). Every other design in this chapter is a refinement of that pair of numbers, and choosing T means choosing between two kinds of error:
| Short timeout | Long timeout | |
|---|---|---|
| Detection time | Fast | Slow: every real crash costs T of unavailability |
| False positives | Frequent: pauses and delays look like death | Rare |
| Cost of each false positive | A failover, data copied to other nodes, maybe two leaders | Same, but it happens less often |
No setting is good on both rows, so choosing T is choosing which failure you'd rather have, and how often. That makes the timeout a design decision, to be priced like one, and the rest of the chapter is about making it well.
?Why not use TCP to tell you the peer is gone?
A natural thought is that the monitor already has a TCP connection to w3, and TCP knows when the other end disappears. It does, but slowly, because TCP's defaults are tuned to wait patiently rather than to detect quickly. A keepalive probe is an empty packet the kernel sends on an otherwise idle connection to check that the peer still answers. On Linux (kernel 6.10) the defaults are:
| Setting | Default | What it means |
|---|---|---|
tcp_keepalive_time | 7,200 s | Idle time before the first keepalive probe (only if SO_KEEPALIVE is set) |
tcp_keepalive_intvl | 75 s | Between probes |
tcp_keepalive_probes | 9 | Probes before giving up: about 11 more minutes |
tcp_retries2 | 15 | Retransmissions of unacknowledged data before the connection dies: at least 924.6 s, per the kernel docs |
Unless a program turns on keepalive with the SO_KEEPALIVE socket option, an idle connection to a machine that lost power never notices at all. Even with it on, the first probe waits two hours, and nine unanswered probes take about eleven minutes more. A connection with unacknowledged data in flight fails faster, but "faster" is still over 15 minutes. Applications that care set their own heartbeats, or TCP_USER_TIMEOUT (a socket option that makes the kernel drop a connection once sent data has gone unacknowledged for that many milliseconds), or both.
3.2A real choice: etcd and Raft
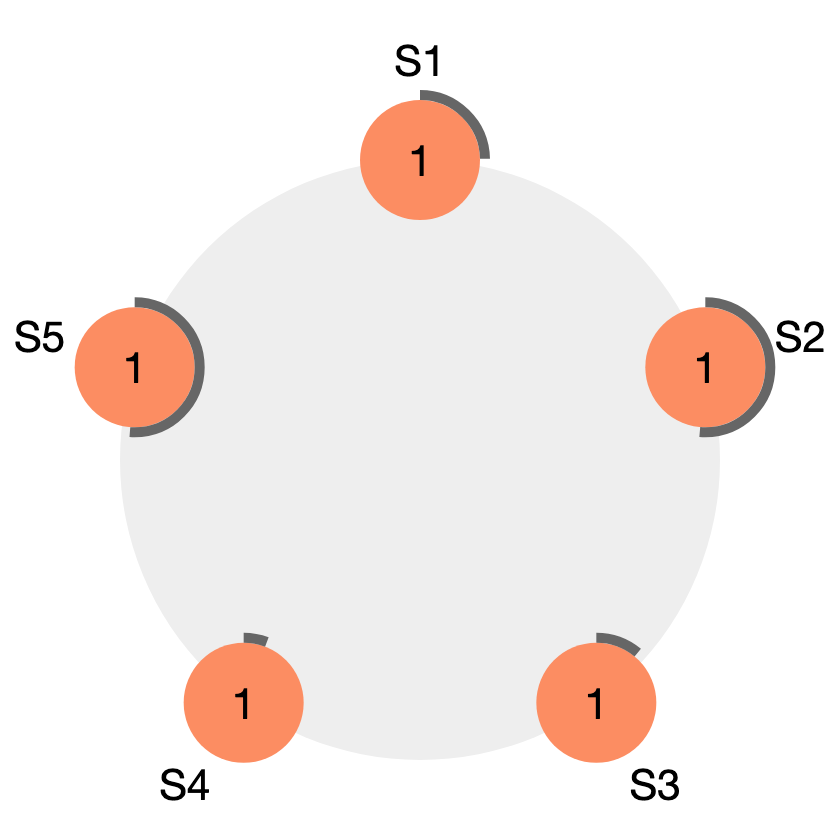
Systems that elect a leader use the same mechanism at a small scale. Raft is a protocol for keeping copies of data on several nodes in step by electing one leader that everyone follows. Its leader sends heartbeats, and a follower that hears nothing for its election timeout assumes the leader is gone and starts an election for a new one.
etcd's tuning guide sets the defaults at a 100 ms heartbeat and a 1,000 ms election timeout, and gives two rules. The heartbeat should be around the round-trip time between members, meaning the time for a message to reach another machine and the reply to come back. The election timeout should be "at least 10 times the round-trip time" so it can absorb variance in the network.
The Raft paper adds one more trick: randomise each follower's election timeout (its example is 150–300 ms). Then one follower usually times out first and wins before the others start competing elections. The consensus chapter follows an election message by message.
An election is cheap and safe to repeat, which is why etcd can afford a timeout as short as one second. For w3 we don't yet know whether 300 ms is too short or too long, because we haven't measured how late a heartbeat from a perfectly healthy process can be.
04How quiet a healthy process gets
4.1Scheduling jitter
To choose T for w3, we need the spread of gaps between heartbeats from a process that is fine. The experiment is a Python loop that sleeps for 100 ms and records the real time since the previous wake-up, 600 times per run. Nothing is wrong with the process. When a thread sleeps, the operating system decides when it gets the CPU back (chapter 06), so on a busy machine it may have to wait its turn. Small random variations in timing like this are called jitter.
The table below summarises each set of runs with three numbers. The median is the middle gap, with half the gaps shorter and half longer. The p99 is the gap that 99 out of 100 heartbeats stay under. The standard deviation is the typical wobble of a gap around the average. There were three runs each on two machines: an idle laptop, and a shared 4-CPU Linux container whose other tenants kept the load average, the number of threads wanting a CPU averaged over a minute, between 7 and 15, so two to four threads were queuing for each CPU.
| Machine | Median gap | p99 | Worst gap per run | Std deviation |
|---|---|---|---|---|
| macOS, idle laptop | 103.3 ms | 105.1 ms | 105.1 · 105.1 · 106.9 ms | 1.7 ms |
| Linux, shared container | 101.0 ms | 104.1–117.4 ms | 112.4 · 146.4 · 132.4 ms | 0.8–2.6 ms |
The laptop's heartbeats are regular to within a few milliseconds. On the busy shared box the worst gap in 600 heartbeats was up to 46% late (146 ms instead of 100), with nothing wrong with the process, because scheduling delay alone does that. Even so, the 300 ms timeout from section 1 has room to spare against these numbers, so jitter isn't what fooled our monitor. What fooled it was a pause, and pauses come from somewhere else.
4.2Garbage collection
A garbage collector does much worse. The next test runs a heartbeat thread sleeping 100 ms inside a Java virtual machine (JVM) whose main thread churns through roughly 800 MB of live objects in a 1.6 GB heap, using the serial collector, for 30 seconds. The heap is the memory the JVM hands out to a program's objects, and the serial collector is the simplest one, which stops every thread while it works. Here is what the heartbeat thread saw:
| Run | Full collections | Longest GC pause | Median heartbeat gap | Worst heartbeat gap |
|---|---|---|---|---|
| 1 | 34 | 2,781 ms | 609 ms | 2,884 ms |
| 2 | 51 | 660 ms | 584 ms | 936 ms |
| 3 | 50 | 769 ms | 592 ms | 943 ms |
The median column shows how constantly this JVM was being stopped: a heartbeat meant for every 100 ms arrived about every 600 ms. That's a deliberately unhappy JVM, close to its heap limit. It is also a realistic one, and it makes the point: a live process with a 100 ms heartbeat went silent for almost three seconds. A detector with a one-second timeout would have declared it dead, and if it had been the leader, it would have woken up still believing it was.
Look at what the two experiments say together. A healthy process is usually regular to within a few milliseconds, and now and then it goes quiet for hundreds or thousands. A single T has to cover the rare long gap, which makes it far too loose for the regular case. And a fixed-timeout detector throws information away. It sees every one of w3's heartbeats arrive, so it could easily learn how regular w3 normally is, yet all it reports is one bit, alive or dead.
05A suspicion level instead of a verdict
A fixed timeout treats a node whose heartbeats arrive like clockwork the same as one whose heartbeats always wander, and it gives the application nothing but a yes or a no. We'd rather have a number that says how suspicious the current silence is, so each part of the system can decide how suspicious is too suspicious for what it's about to do.
5.1The phi accrual detector
Picture w3's heartbeats arriving every 101 ms, give or take 2. A silence of 105 ms is ordinary. A silence of 150 ms is odd. A silence of one second would be astonishing, if w3 were healthy. The detector can put a number on that surprise, using the gaps it has seen.
Hayashibara, Défago, Yared and Katayama's φ accrual failure detector (SRDS 2004) does that. It keeps a window of recent heartbeat inter-arrival times (the gaps between consecutive heartbeats), fits a distribution to them, and asks: given how long it's been since the last heartbeat, how unlikely is it that a healthy node would be this quiet?
"Fits a distribution" needs a word of explanation. To answer that question the detector needs a model of how likely each length of gap is. Two systems we'll look at, Akka (a toolkit for building clustered services on the JVM) and Cassandra (a distributed database), choose differently. Akka assumes gaps follow a normal distribution, the familiar bell curve centred on the average gap with a width given by the standard deviation. Cassandra uses a simpler exponential model, in which the chance of waiting past a time t depends only on t divided by the average gap.
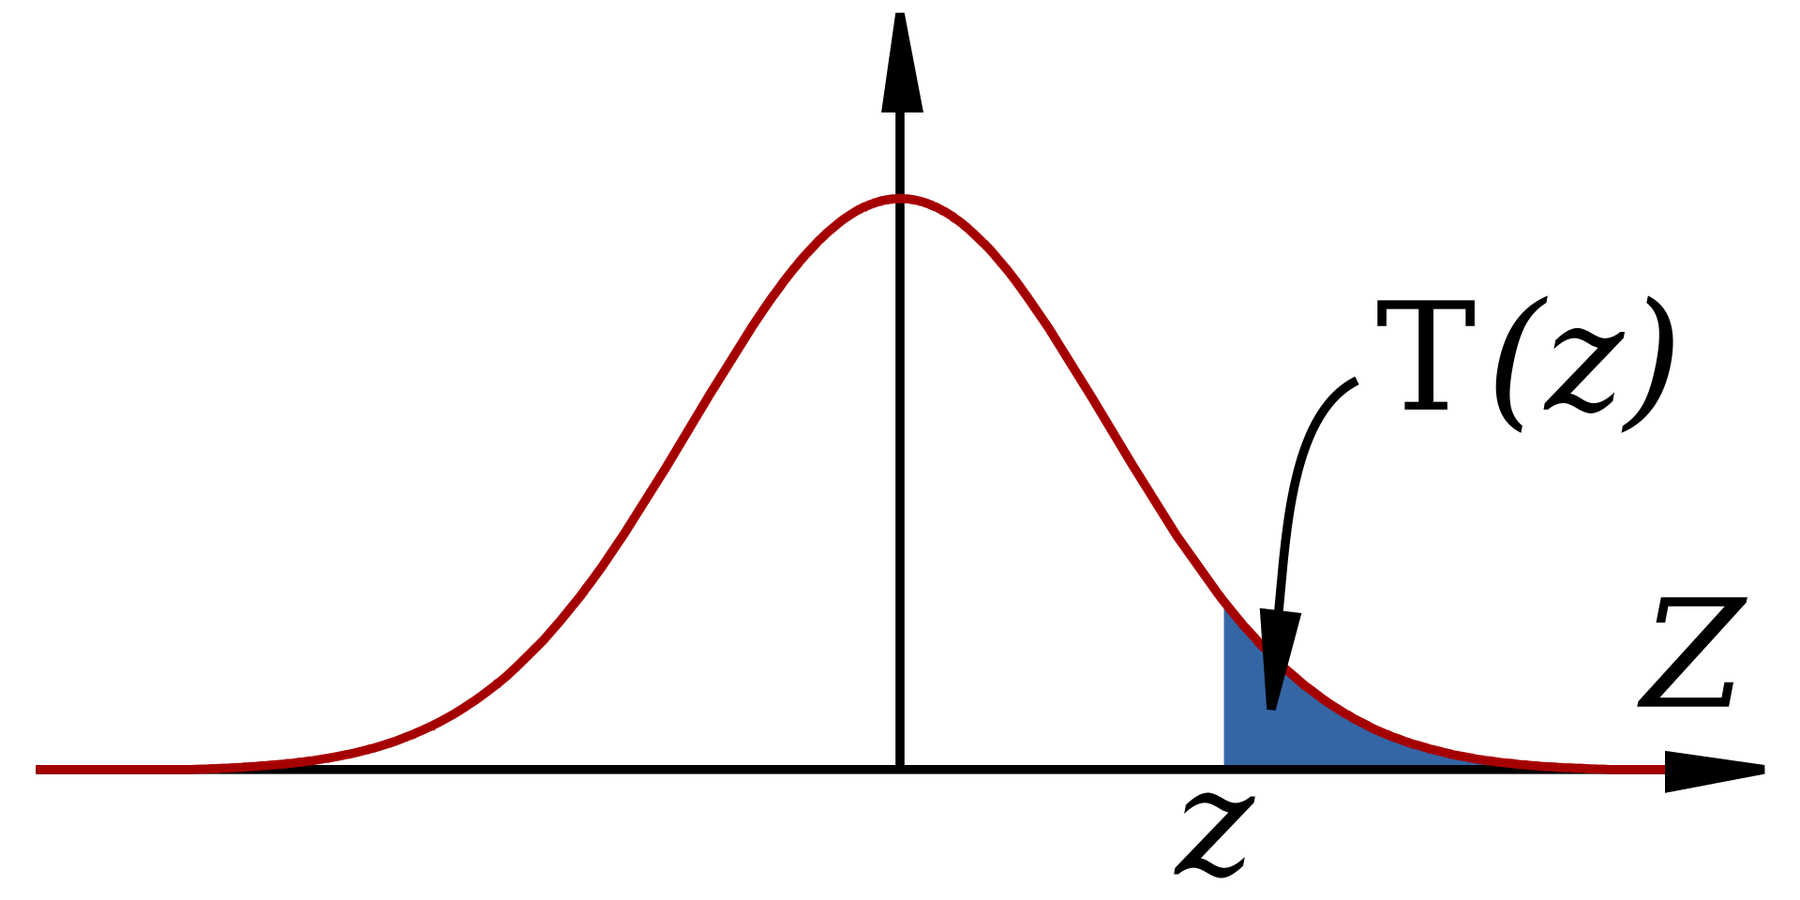
With a model in hand, the detector takes the current silence and asks the model for the probability that a healthy node's next heartbeat would come even later than this. Call that P. If P is large, the silence is ordinary. If it's tiny, the silence is suspicious. φ is that probability on a log scale:
φ = −log10(P(a heartbeat arrives later than now))
So φ = 1 means P is 1 in 10, φ = 2 means 1 in 100, and so on. The paper puts it plainly: if you suspect a node when φ ≥ 1, "the likeliness that we will make a mistake … is about 10%. The likeliness is about 1% with Φ = 2, 0.1% with Φ = 3, and so on." A threshold of 8, the default in both Cassandra and Akka, means a one-in-a-hundred-million chance, if the model is right.
The last step is the point of the whole design. The detector reports how suspicious it is and each consumer decides. A load balancer that merely stops sending new requests to w3 can act at a low φ, because a mistake costs a little capacity. A failover that promotes a replacement should wait for a high one.
5.2Akka's version, and why it floors the deviation
Here is how Akka computes φ. The first function gathers the inputs, and the second turns a delay into a number:
  private def phi(timestamp: Long): Double = {
    val oldState = state.get
    val oldTimestamp = oldState.timestamp

    if (oldTimestamp.isEmpty) 0.0 // treat unmanaged connections, e.g. with zero heartbeats, as healthy connections
    else {
      val timeDiff = timestamp - oldTimestamp.get

      val history = oldState.history
      val mean = history.mean
      val stdDeviation = ensureValidStdDeviation(history.stdDeviation)

      phi(timeDiff, mean + acceptableHeartbeatPauseMillis, stdDeviation)
    }
  }
  /* ... */
  private[akka] def phi(timeDiff: Long, mean: Double, stdDeviation: Double): Double = {
    val y = (timeDiff - mean) / stdDeviation
    val e = math.exp(-y * (1.5976 + 0.070566 * y * y))
    if (timeDiff > mean)
      -math.log10(e / (1.0 + e))
    else
      -math.log10(1.0 - 1.0 / (1.0 + e))
  }
The second function measures the delay in standard deviations (y) and converts that to a tail probability with a formula that approximates the bell curve. Two lines in the first function carry lessons from production. acceptableHeartbeatPauseMillis is added to the mean, so the detector treats pauses of that length as normal. And ensureValidStdDeviation never lets the deviation drop below min-std-deviation. Why bother? Imagine w3 running on the busy shared Linux box from section 4, and try the numbers before reading the answer.
A heartbeat sender on the busy Linux box has a mean gap of 101.1 ms and a standard deviation of 2.4 ms. With no floor and no acceptable pause, at what gap does φ reach 8?
You can reproduce those numbers with Akka's formula copied into a few lines of Python. The script scores five heartbeat gaps twice, once with the raw 2.4 ms deviation and once with the deviation floored at 100 ms. Then it scores longer silences using Akka's real defaults: a heartbeat once a second, 3 s of acceptable pause added to the mean, and the 100 ms floor.
import math

def phi(gap, mean, std):
    # Akka's formula (PhiAccrualFailureDetector.scala, v2.6.20), gaps in ms
    y = (gap - mean) / std
    e = math.exp(-y * (1.5976 + 0.070566 * y * y))
    if gap > mean:
        return -math.log10(e / (1.0 + e))
    return -math.log10(1.0 - 1.0 / (1.0 + e))

mean = 101.1                 # a busy Linux box: heartbeats every ~101 ms ...
print("gap    raw (std 2.4)   std floored to 100")
for gap in (105, 112, 114, 132, 146):
    print(f"{gap} ms  {phi(gap, mean, 2.4):12.1f}  {phi(gap, mean, 100):14.2f}")

print()
print("Akka defaults: mean 1000 ms + 3000 ms acceptable pause, std 100 ms")
for gap in (4000, 4400, 4500, 4600):
print(f"silence {gap} ms phi = {phi(gap, 1000 + 3000, 100):.1f}")gap raw (std 2.4) std floored to 100
105 ms 1.3 0.31
112 ms 6.0 0.34
114 ms 8.5 0.35
132 ms 74.3 0.42
146 ms 213.7 0.49
Akka defaults: mean 1000 ms + 3000 ms acceptable pause, std 100 ms
silence 4000 ms phi = 0.3
silence 4400 ms phi = 4.7
silence 4500 ms phi = 7.3
silence 4600 ms phi = 10.8The first table shows the problem. With the raw standard deviation of 2.4 ms, φ climbs past 8 at 114 ms and reaches 214 at 146 ms, though that gap is ordinary jitter on a busy machine. With the floor at 100 ms, the same gaps all score under 0.5. The second table shows what Akka's defaults do to a heartbeat sent once a second: φ crosses 8 at about 4.5 seconds of silence. That's a timeout in disguise, but one that stretches by itself if the heartbeats become irregular.
5.3Cassandra's version, with a guard for its own pauses
Cassandra's nodes watch each other's heartbeats too (they arrive through a mechanism called gossip, which section 7 explains). Its detector keeps the name φ and drops the normal distribution:
    public void interpret(InetAddressAndPort ep)
    {
        /* ... */
        long now = preciseTime.now();
        long diff = now - lastInterpret;
        lastInterpret = now;
        if (diff > MAX_LOCAL_PAUSE_IN_NANOS)
        {
            logger.warn("Not marking nodes down due to local pause of {}ns > {}ns", diff, MAX_LOCAL_PAUSE_IN_NANOS);
            lastPause = now;
            return;
        }
        /* ... */
        double phi = hbWnd.phi(now);
        /* ... */
        if (PHI_FACTOR * phi > getPhiConvictThreshold())
        {
            /* ... */
                listener.convict(ep, phi);
        }
    }

    // see CASSANDRA-2597 for an explanation of the math at work here.
    double phi(long tnow)
    {
        assert arrivalIntervals.mean() > 0 && tLast > 0; // should not be called before any samples arrive
        long t = tnow - tLast;
        lastReportedPhi = t / mean();
        return lastReportedPhi;
    }
phi here is the elapsed time divided by the mean interval, and PHI_FACTOR is 1 / ln(10). The two together give the exponential model's answer. In that model the chance of a heartbeat arriving later than t is e^(−t/mean), and taking −log10 of that gives (t/mean) / ln(10). So a node is convicted when its silence exceeds 8 × ln(10) ≈ 18.4 times its mean heartbeat interval. With gossip running once a second (Gossiper.intervalInMillis = 1000), that's around 18 seconds.
?Why check for a local pause first?
Because of the last row of the table in section 2.1. If interpret itself hasn't run for more than 5 seconds (DEFAULT_MAX_PAUSE), the silence it's about to judge is probably its own fault: a GC pause or a stalled VM on this node. Cassandra logs "Not marking nodes down due to local pause" and refuses to convict anyone until the pause is 5 seconds behind it. The check costs a few lines, and a detector without it turns its own pause into a verdict that the whole cluster has died.
With a suspicion level in hand, the next question is what to do at each level. Declaring w3 suspect and acting on it are two different decisions, and the best-known system shows how to keep them apart.
06Suspect first, act later
6.1Kubernetes: a chain of timeouts
Kubernetes runs your programs in containers (chapter 11) grouped into pods, spread over machines it calls nodes. Usually you don't create pods one by one. You create a Deployment, which says "keep this many copies of this pod running", and Kubernetes creates or replaces pods to match. Let w3 now be a whole machine in such a cluster, running a pod called web-1 that belongs to a Deployment.
The cluster keeps its state in a central service, the API server. On each node an agent called the kubelet keeps a small record there, the node's Lease, and renews it every 10 seconds. The renewal is the node's heartbeat, and it's lighter than updating the node's whole status. Inside the cluster, the node controller (in full, the node lifecycle controller) checks every 5 seconds which nodes have stopped renewing. Step through what happens when w3 loses power:
w3 renews the node's Lease every 10 seconds, and the controller sees a fresh heartbeat each time it looks. Pod web-1 runs on w3.Adding up the delays gives the time from power loss to eviction. The controller's 5-second check adds up to one more interval in the worst case, because the grace period may run out just after it looked.
| Lease renewal interval | kubelet default | 10 s |
| Grace period before NotReady / Unknown | --node-monitor-grace-period | 50 s |
| Default unreachable toleration | tolerationSeconds | 300 s |
| Controller check interval (worst case added) | --node-monitor-period | ≤ 5 s |
| Time from power loss to eviction, defaults | ≈ 5 min 55 s | |
?Why wait five minutes when the node was declared unreachable at 50 seconds?
Because declaring a node unreachable is cheap and reversible, and evicting its pods isn't. A node that was merely cut off from the API server is still running its pods, so evicting them early starts a second copy of every pod while the first may still be serving, which is the duplicate w4 from section 1 at the scale of a whole machine. Kubernetes separates suspecting from acting, and gives acting a much longer fuse. Workloads that need faster failover set a smaller tolerationSeconds on their own pods.
It also refuses to act on a mass failure. If more than 55% of nodes in a zone are unhealthy (--unhealthy-zone-threshold), the controller slows evictions sharply, on the theory that the problem is more likely the controller's own connectivity than half the zone dying at once (nodes docs).
In Kubernetes, one controller does the watching and forms one opinion about each node. That worked for w3's lone monitor too, but it leaves two problems. The monitor's own view might be the broken one, as in row four of our table. And with thousands of nodes, you can't have every node watch every other.
07Many watchers: gossip and SWIM
Heartbeats answer "is that node alive?" for one monitor. A cluster needs every member to agree, roughly, on the whole membership list, the list of which nodes are in the cluster and alive. The naive way to get there is for every node to send heartbeats to every other node. With n nodes that's about n² messages per interval: with a thousand nodes and one heartbeat a second, a million messages a second, and the load grows with the square of the cluster.
7.1Gossip: spreading news like an epidemic
Think of how a rumour spreads in an office. Nobody tells everyone. Each person tells one or two others, who each tell one or two more, and soon the whole office knows. A gossip protocol does the same: each node periodically picks a few random peers and exchanges what it knows with them.
Suppose w1 probes w3, gets no answer, and starts suspecting it. Here's how that suspicion spreads through a cluster of eight nodes if each node that knows the rumour tells one peer per round:
w1 probed w3 and got no answer, so w1 suspects it. Nobody else knows. The other seven nodes still think w3 is fine.In this idealised picture the number of nodes that know doubles each round, so eight nodes need three rounds and a thousand would need about ten, because 2 to the power 10 is about 1,000. That's what O(log n) rounds means, and meanwhile each node sends a constant number of messages per round. Real gossip picks peers at random, so some messages land on nodes that already know and it takes a few more rounds than the ideal, but the growth stays logarithmic.
Cassandra gossips once a second to a random live peer (and sometimes to a seed, one of a few well-known nodes that new members contact first, or to a node it currently believes is unreachable). Each node's state carries a heartbeat counter that the node increments itself, so a peer knows a node is alive when that counter keeps going up, even if it heard the news second- or third-hand. That counter is what feeds the φ detector from section 5.3.
So in Cassandra, gossip does two jobs at once. It spreads news, and it is also how nodes find out who is alive, since the heartbeat counters travel the same second-hand way. That works, but it makes detection only as fresh as the latest rumour, and nobody ever checks w3 directly. A cleaner design would split finding failures from spreading the news.
7.2SWIM: probe, ask for help, then suspect
Das, Gupta and Motivala's SWIM (DSN 2002; the name stands for Scalable Weakly-consistent Infection-style process group Membership) does exactly that, separating detecting failures from disseminating (spreading) membership changes. Detection is a direct check: each period, a node pings one other node and waits for a reply, an ack. Dissemination rides along on those same ping and ack messages, which is called piggybacking, and it spreads news the way we just watched.
One more piece of state makes it work. Every node keeps an incarnation number about itself, a counter that only that node may increase. Any rumour about a node is tagged with the node's incarnation number, and a message with a higher number beats one with a lower number. Follow one probe period, with M as the prober and N as its target (in our story, M is w1 and N is w3):
The indirect probe handles the case where the path between w1 and w3 is the broken part, and w3 is fine. The suspect step handles the case where w3 is merely slow or paused, as in section 1: the rumour reaches w3, which can answer for itself, and its higher incarnation number wins. Only a node that stays silent through all of that is declared dead.
?Why does the load stay constant as the cluster grows?
Because each member sends one probe per period, plus at most k indirect requests when a probe fails, whatever the group size. The SWIM paper shows the expected time until some member first detects a crash is at most e/(e−1), about 1.58 protocol periods, also independent of group size. Picking probe targets round-robin from a shuffled list, instead of at random, bounds the worst case: every member is probed by each other member within 2n − 1 periods.
7.3memberlist: SWIM in production
HashiCorp's memberlist is the SWIM implementation inside Consul (which tracks which services run where), Nomad (which schedules jobs onto machines) and Serf (a standalone membership tool). Its defaults for a local network, from config.go at v0.5.1:
| Setting | Default | Meaning |
|---|---|---|
ProbeInterval | 1 s | One probe per period |
ProbeTimeout | 500 ms | Before falling back to indirect probes |
IndirectChecks | 3 | Helpers asked to ping the target |
SuspicionMult | 4 | Scales the suspicion timeout |
SuspicionMaxTimeoutMult | 6 | Upper bound, as a multiple of the minimum |
GossipInterval / GossipNodes | 200 ms / 3 | Dissemination of updates |
AwarenessMaxMultiplier | 8 | How far a struggling node slows its own probing |
The suspicion timeout grows with the cluster, because rumours take longer to reach a node in a big cluster, and a suspect needs time to hear and refute its own suspicion. From util.go, the minimum is SuspicionMult × max(1, log10(n)) × ProbeInterval:
| Cluster size | Minimum suspicion timeout | Maximum (6×) |
|---|---|---|
| 10 nodes | 4 s | 24 s |
| 100 nodes | 8 s | 48 s |
| 1,000 nodes | 12 s | 72 s |
| 10,000 nodes | 16 s | 96 s |
(The comment in config.go says the maximum reaches "120 seconds" for 10,000 nodes; the formula in util.go gives 96.)
7.4Lifeguard: when the prober is the problem
SWIM has the same weakness Cassandra guards against with its local-pause check: a node that is slow to process messages misses acks, suspects healthy peers, and spreads false rumours. Dadgar, Phillips and Currey's Lifeguard extensions to memberlist fix that in two ways.
First, local health awareness. A node that has to refute suspicions about itself, or whose probes keep failing, raises its own "awareness" score and stretches its probe interval, up to 8× by default. A struggling node becomes a more patient judge.
Second, suspicion that accelerates with independent confirmations. The suspicion timer starts at the maximum and shrinks as other members independently confirm the suspicion:
// remainingSuspicionTime takes the state variables of the suspicion timer and
// calculates the remaining time to wait before considering a node dead. The
// return value can be negative, so be prepared to fire the timer immediately in
// that case.
func remainingSuspicionTime(n, k int32, elapsed time.Duration, min, max time.Duration) time.Duration {
	frac := math.Log(float64(n)+1.0) / math.Log(float64(k)+1.0)
	raw := max.Seconds() - frac*(max.Seconds()-min.Seconds())
	timeout := time.Duration(math.Floor(1000.0*raw)) * time.Millisecond
	if timeout < min {
		timeout = min
	}

	// We have to take into account the amount of time that has passed so
	// far, so we get the right overall timeout.
	return timeout - elapsed
}
Here n is the number of independent confirmations received so far, and k is the number wanted, set to SuspicionMult − 2, so 2 by default. With none, a suspect in a 100-node cluster gets the full 48 seconds to refute. One independent confirmation brings the timer down to about 23 seconds, and the second brings it to the 8-second minimum. One confused node alone can't get w3 removed quickly. Several agreeing nodes can.
Many witnesses, a suspicion that the suspect can answer, and a detector that distrusts itself all make a wrong verdict rarer. None of them makes it impossible, as section 2 told us. So the last question is the one section 1 left hanging: when a verdict turns out wrong, what stops the replacement and the original from both acting as the leader?
08When the verdict is wrong
A false positive in a load balancer costs a little capacity. A false positive in a leader election costs much more: the old leader is still alive, still believes it's the leader, and now there are two. That state is called split brain, and it's how w3 and w4 ended up in section 1.
8.1What a 43-second partition did at GitHub
On 21 October 2018, routine maintenance to replace failing optical equipment cut connectivity between GitHub's US East Coast network hub and its primary East Coast data center. Connectivity came back in 43 seconds. In that window, their MySQL failover tool, Orchestrator, promoted primaries on the West Coast. (A primary is the database copy that accepts writes. The others, the replicas, copy it.)
When the network healed, both coasts held writes the other didn't have: several seconds of East Coast writes that hadn't replicated west, and, by the time the team came to rebuild the topology, nearly 40 minutes of application writes on the West Coast primaries. Failing back wasn't safe, and the incident ran to 24 hours and 11 minutes of degraded service while they reconciled.
?Why was 43 seconds enough to cause a day of damage?
Because the failover's timeout was shorter than the partition, and the action it triggered wasn't reversible. The detector was right that the East Coast was unreachable from where it stood. It was wrong about what that meant, and promotion across regions turned a 43-second network event into divergent histories.
8.2The tools that stop two leaders
Systems stack several defences, each closing a different hole. Here they are on w3, the leader that was wrongly declared dead, and w4, the replacement.
A quorum is a majority of the members, such as three out of five. Two groups can't both hold a majority, so if a leader must keep in touch with a majority to act, at most one side of a partition can have a working leader. If w3 is cut off with a minority, it has to stop leading, and the majority can elect w4. A lease is a promise of leadership that runs out after a fixed time unless it's renewed. If w3 can't renew, its lease lapses, and w4 takes over only once it has waited the lease out. An epoch (Raft calls it a term) is a number that goes up by one with every new leader, so w4 leads in a higher epoch than w3, and followers reject messages from a leader with an older one. A fencing token applies the same idea at the storage, and it gets a scene of its own below. STONITH stands for "shoot the other node in the head", and it means what it says: cut the power to w3 before promoting w4.
| Tool | How it works | Examples |
|---|---|---|
| Majority quorum | A leader must be able to reach a majority. At most one side of a partition has one | Raft, ZooKeeper, etcd, Redis Cluster's master votes |
| Leases | Leadership expires after a fixed time unless renewed; a new leader waits it out | etcd leases, Chubby, ZooKeeper sessions |
| Epochs / terms | Each new leader gets a higher number; followers reject older ones | Raft terms, Kafka leader epochs, Redis configEpoch |
| Fencing tokens | The storage rejects writes carrying an older token | ZooKeeper zxid, etcd revisions used as tokens |
| STONITH | Power off or isolate the old node before promoting | Pacemaker fencing, cloud API "stop instance" |
In the table, Chubby is Google's lock service, ZooKeeper and etcd are open-source services of the same kind, a zxid is ZooKeeper's ever-increasing transaction number, and Pacemaker is a Linux tool for managing high-availability clusters.
?Why isn't a lease enough on its own?
Because a lease is a promise about time, and the process holding it can lose track of time. A leader that's paused for longer than its lease wakes up, doesn't know how long it was out, and writes as if it still holds the lease. That's w3 from section 1 again, with the pause stretched past the lease. The JVM in section 4 paused for 2.9 seconds. Martin Kleppmann's analysis of distributed locking notes HBase GC pauses that lasted minutes, and a GitHub incident where packets were delayed about 90 seconds.
The fix is to make the thing being protected do the checking, instead of trusting the lock holder. Every time the lock service grants the lease, it hands out a fencing token, a number that goes up with each grant. The storage remembers the highest token it has accepted and rejects anything lower:
w3 takes the lease. The lock service gives it token 33, a number that rises with every grant. Storage hasn't seen any token yet.We now have the pieces: detectors that give a suspicion level, a separate step for acting, many witnesses, and fencing for the actions that must have one owner. What's left is to put numbers on them for a real system.
09Choosing a timeout on purpose
9.1Defaults across real systems
Here's how the systems in this chapter answer "how long until a silent node is declared failed, and what happens then":
| System | Heartbeat | Declared failed after | What happens then |
|---|---|---|---|
| etcd / Raft | 100 ms | 1 s election timeout | New election |
| Akka Cluster | 1 s | φ > 8 ≈ 4.5 s of silence | Marked unreachable; removing it from the cluster is a separate decision |
| memberlist (Consul) | 1 s probe | 8–48 s suspicion at 100 nodes | Marked dead, removed from the service list |
| Cassandra | 1 s gossip | φ > 8 ≈ 18 × mean interval | Marked down; no data moves |
| Redis Cluster | cluster-node-timeout, 15 s by default | Majority of masters within 2 × timeout | Replica promoted |
| ZooKeeper sessions | Client pings | Negotiated, 2–20 × tickTime | The session's ephemeral nodes (records tied to it) are deleted |
| Kubernetes nodes | 10 s lease | 50 s | Tainted; pods evicted 300 s later |
The answers run from one second to about six minutes, and each is reasonable for what it triggers. etcd's timeout is short because an election is cheap and safe. A Kubernetes eviction is slow because rescheduling a node's worth of pods is expensive and may duplicate them.
9.2Watching it on a real cluster
Each question the chapter raised has a command that answers it on a running system.
# What will TCP do about a dead peer? (section 3.1)
sysctl net.ipv4.tcp_keepalive_time net.ipv4.tcp_keepalive_intvl \
       net.ipv4.tcp_keepalive_probes net.ipv4.tcp_retries2
ss -tno                              # per-connection timers, including keepalive

# How is Kubernetes tracking this node's heartbeat? (section 6)
kubectl get lease -n kube-node-lease
kubectl describe node NODE           # Conditions, and any unreachable taint

# What does the cluster believe about its members? (section 7)
consul members                       # alive / failed, from memberlist
redis-cli cluster nodes              # fail? (PFAIL) and fail flags

# Is a node convicting others because of its own pause? (section 5.3)
grep "Not marking nodes down due to local pause" system.log # Cassandra9.3Rules that hold up
- Measure the healthy gap distribution on your real machines under real load, including GC. Size the timeout from the worst gap, because the p99 leaves out exactly the rare pauses that fool detectors.
- Price both errors. What does a missed crash cost per second? What does one false positive cost: a failover, a cold cache, a rebalance, a possible second leader?
- Split suspect from act. Suspect early and cheaply (stop routing reads there); act late and expensively (promote, evict, move data).
- Require independent witnesses for expensive actions: a quorum, indirect probes, confirmations from other nodes.
- Guard against your own pauses. If the detector itself was stalled, don't convict anyone.
- Rate-limit actions. If many nodes look dead at once, the observer is the likeliest suspect.
- Fence anything that must have one owner.
9.4What you trade for what
Each tool in the chapter buys something and charges for it somewhere else. In the tables below, flapping means a node being marked down and back up again and again, the pattern a too-short timeout produces.
| You get | You pay | When the bill arrives |
|---|---|---|
| A short timeout: crashes found fast | Healthy nodes convicted during pauses and jitter | As flapping, needless failovers, a possible second leader |
| A long timeout: few false alarms | Every real crash costs the whole timeout | As minutes of downtime on a real failure |
| A φ detector: one dial per consumer | A model that can be overconfident in the tail | As false convictions if the deviation isn't floored |
| Gossip and SWIM: constant load per node | News takes several periods to arrive, and suspicion takes seconds to clear | As slow detection in large clusters |
| Fencing tokens: stale leaders can't write | The storage has to check them | As silent corruption if it doesn't |
9.5Symptom, cause, fix
| Symptom | Likely cause | Fix |
|---|---|---|
| Nodes flap between up and down | Timeout below the healthy gap distribution | Lengthen it, raise φ threshold, add acceptable pause |
| Many nodes marked down at once, then back | The observer paused or lost its network | Local-pause guard; Lifeguard-style awareness; rate-limit actions |
| Failover takes minutes | Long chain of timeouts (e.g. Kubernetes defaults) | Shorter tolerationSeconds for that workload; app-level health checks |
| Two primaries after a network blip | Failover without quorum or fencing | Majority quorum, fencing tokens, STONITH |
| Dead peer's TCP connections stay open for hours | Kernel keepalive defaults | App heartbeats, TCP_USER_TIMEOUT, shorter keepalive on those sockets |
| Healthy node repeatedly suspected by one peer only | Asymmetric path or gray failure | Indirect probes; require multiple witnesses |
Not marking nodes down due to local pause in Cassandra logs | GC or VM stall on that node | Fix the pause; the detector is protecting you |
10Summary
- A dead node and a slow one look the same. Across a network, failure detection is always a guess made from silence, and a monitor that guesses "dead" about a live worker has made a false positive.
- Every timeout trades detection time for false positives. There's no setting that's good at both, so pick by what each error costs.
- TCP won't tell you in time. Without keepalive an idle dead peer is never noticed, and with it the first probe waits two hours.
- Healthy processes go quiet for surprisingly long. A 100 ms heartbeat ran up to 46% late on a shared box, and a JVM busy with garbage collection went silent for 2.9 s.
- Accrual detectors output a suspicion level. φ is a log10 mistake probability, and each consumer can pick its own threshold.
- Fitted distributions are overconfident in the tail. That's why Akka floors the standard deviation and adds an acceptable pause.
- Detectors must distrust themselves. Cassandra's local-pause guard stops a stalled node from convicting everyone.
- Separate suspecting from acting. Kubernetes marks a node unreachable at 50 s and evicts its pods only after 300 more.
- SWIM keeps per-node load constant. Direct probe, indirect probes through k helpers, then suspicion that the suspect can refute with a higher incarnation, spread by gossip in about log n rounds.
- Lifeguard adds local health and witnesses. A struggling node probes more slowly, and a suspicion shrinks only as independent members confirm it.
- A wrong verdict becomes split brain without quorums and fencing. Leases alone fail when the holder pauses; storage that checks tokens doesn't.
11Build this
A failure detector you can break.
- Write a heartbeat sender and a monitor over UDP. Log every inter-arrival gap, then run it on a loaded machine and inside a JVM or Go process under allocation pressure. Plot the gap distribution and mark where a 3-interval timeout would have convicted.
- Implement φ with both the normal and exponential models over the same logged gaps. For thresholds 1 through 12, count false convictions and the delay to detect a real
kill -9. - Build a five-node SWIM simulation with message loss and one node that processes messages slowly. Count false "dead" verdicts with and without indirect probes, and with and without a Lifeguard-style awareness score.
- Add a fencing check to a toy key-value store and show a paused lock holder's write being rejected.
12Interview questions
beginnerWhy can't a distributed system reliably detect that a node has crashed?›
It only sees messages, and a crashed node, a paused one and one behind a broken link all produce the same silence. Any detector either waits, and is slow on real crashes, or guesses, and sometimes convicts a healthy node. FLP makes this formal for asynchronous systems: no deterministic protocol can guarantee consensus if one process may crash, because it can't know whether to keep waiting.
beginnerWhat's the trade-off in choosing a heartbeat timeout?›
A short timeout detects crashes quickly and produces more false positives from GC pauses, scheduling delay and network jitter. A long one is accurate and slow, because every real crash costs the whole timeout in downtime. Pick it from the worst gap a healthy process produces under load, and from what each kind of error costs.
intermediateHow does the phi accrual failure detector work?›
It records heartbeat inter-arrival times in a sliding window, fits a distribution (normal in Akka, exponential in Cassandra), and computes φ = −log10 of the probability that a heartbeat would still arrive given the time since the last one. φ = 1 means about a 10% chance of a mistake, φ = 2 about 1%. Applications choose thresholds; 8 is the common default.
intermediateWalk through SWIM's failure detection.›
Each period a member pings one random (or round-robin) peer. If no ack arrives within the probe timeout, it asks k other members to ping that peer. If none succeed, it marks the peer suspect and gossips that with the peer's incarnation number. The peer can refute by gossiping alive with a higher incarnation. If the suspicion timeout passes without refutation, the peer is declared dead. Updates piggyback on probe messages, so load per member is constant.
intermediateA Kubernetes node loses power. How long until its pods run elsewhere, and why?›
About six minutes with defaults. The kubelet renews a Lease every 10 s; after 50 s without one (node-monitor-grace-period) the node goes Unknown and gets an unreachable:NoExecute taint. Pods tolerate that taint for 300 s by default, then are evicted and rescheduled. The long toleration exists because a merely partitioned node may still be running its pods.
deepWhy does Akka enforce a minimum standard deviation in its phi detector?›
Because a very regular heartbeat gives a tiny standard deviation, and a normal distribution with a tiny deviation calls any small delay astronomically unlikely. On a busy shared Linux box the gaps have a mean of about 101 ms and a deviation of about 2.4 ms. With those, φ would cross 8 at 114 ms, and a real 146 ms scheduling hiccup would score about 214. The floor (100 ms by default) plus an acceptable heartbeat pause (3 s) keeps ordinary jitter from convicting healthy nodes.
deepA leader holds a 10-second lease. Why can it still corrupt data, and what fixes it?›
It can pause (GC, VM stall) for longer than the lease, wake without knowing time passed, and write while a new leader also writes. Clocks and leases can't fix that from the holder's side. The fix is at the resource: every grant carries a monotonically increasing fencing token, and storage rejects any write with a token lower than the highest it has seen. Consensus-based stores provide suitable tokens (ZooKeeper zxid, etcd revision).
deepWhat went wrong in GitHub's October 2018 incident, in failure-detection terms?›
A 43-second partition exceeded the failover tool's detection threshold, so Orchestrator promoted West Coast primaries while East Coast ones still held unreplicated writes. The detector was locally correct and globally wrong, and the action (cross-region promotion) wasn't reversible. Both sides then had writes the other lacked, and recovery took over 24 hours. The lessons: price the action, not just the detection, and don't let a short partition trigger an irreversible topology change.
13Go deeper
φ = 3. What's the probability the detector is wrong, according to the paper's model?›
About 0.1%: each unit of φ is a factor of ten.
Cassandra with phi_convict_threshold 8 and 1-second gossip. Roughly how long a silence convicts a node?›
About 18 seconds: phi is t / mean scaled by 1/ln 10, so conviction needs t above 8 × ln 10 ≈ 18.4 mean intervals.
In SWIM, who can increment a node's incarnation number?›
Only the node itself, when it refutes a suspicion. That's why its alive message always overrides the suspect rumour.
Why does Kubernetes slow evictions when more than 55% of a zone looks unhealthy?›
Because a mass failure is more likely a problem with the controller's own view, such as a partition, than half the zone dying at once. Evicting everything would make it worse.
Randomised probing, indirect probes, suspicion and infection-style dissemination, with the analysis of detection time and load. PDF
The accrual idea and the φ scale, with measurements against fixed-timeout detectors. DOI
What went wrong with SWIM in HashiCorp's production clusters and the local health extensions that fixed it. arXiv 1707.00788
Completeness, accuracy, and the failure-detector classes that make consensus solvable. PDF
A 43-second partition, a cross-region failover and 24 hours of recovery, told in detail. github.blog
Why leases need fencing tokens, with the pause and delay examples. martin.kleppmann.com
14Related chapters
Elections, terms and leases, the machinery that turns a failure verdict into one new leader. Chapter 27.
What a failover can lose, depending on how replicas were kept in step. Chapter 28.
Why moving a dead node's partitions is expensive, and why systems wait before doing it. Chapter 29.
Where the long tail of heartbeat gaps comes from: scheduling, queueing and pauses. Chapter 16.