Picture an array of numbers in which every number is the position of the next one to read. You start somewhere, read the number there, jump to the position it names, read that one, and carry on. In C the loop body is a single line, p = next[p]. You run it twenty million times and divide the total time by twenty million to find what one trip costs.
You'd expect the answer to depend on the code, and here the code never changes. Give the loop a small array and a trip takes about one nanosecond, a billionth of a second. Give the same loop a big array and a trip takes about seventy. The instruction and the loop are identical in both runs, and only the array got bigger. At the slow end the processor spends each trip waiting for as long as it would take to run hundreds of instructions.
What decides the price is where the number you ask for happens to be stored. A modern processor chip contains several cores, independent units that each run their own stream of instructions. Next to each core sits a small, fast memory holding copies of recently used data, called a cache. A read that finds its number in the cache is fast, and one that doesn't has to travel much farther. This chapter asks why the size of an array changes the price of a read, and what you can do about it in your own code. We'll answer it by following that one loop, first through a single core's caches and finally across two cores that share memory.
01Timing the loop at three sizes
1.1The program
Save the program below as chase.c. It does three things. First, it makes an array next of 8-byte numbers (a size_t is 8 bytes on a 64-bit machine) in which next[i] starts out equal to i. Second, it shuffles the array with Sattolo's algorithm, which guarantees that the result is one single loop through every position: start anywhere, keep following the numbers, and you visit every position exactly once before arriving back where you began. Third, it follows that loop twenty million times with p = next[p] and divides the elapsed time by twenty million.
Notice what each trip needs. To read next[p] the processor has to know p, and p is the number that the previous trip read. So no trip can start before the one before it has finished, and the time per trip is the time of one read. A read of one value from memory into the processor is called a load, so the program times one load per trip. Section 4 explains why we built the loop this way, and for now all that matters is that each load has to wait for the one before it.
One line in the program needs explaining: if (p == (size_t)-1) puts(""). It never fires, but it uses the final value of p. Without it the compiler could see that the loop's result is never used and delete the whole loop, and we'd time nothing.
Compile it with clang -O2 chase.c -o chase and run ./chase. With -O2 the compiler optimizes, as it would for a release build. The program times three array sizes: 16 KB (16,384 bytes, so 2,048 numbers), 1 MB, and 64 MB.
The loop runs on a 16 KB array, then on a 64 MB array. Same instruction, same loop, same number of trips. How much longer does one trip take on the big array?
1.2Running it
#include <stdio.h>
#include <stdlib.h>
#include <time.h>

static double now(void) {
    struct timespec t; clock_gettime(CLOCK_MONOTONIC, &t);
    return t.tv_sec + t.tv_nsec * 1e-9;
}

// Walk a random cycle through an array: every load needs the previous result.
static double ns_per_load(size_t bytes) {
    size_t n = bytes / sizeof(size_t);
    size_t *next = malloc(n * sizeof *next);
    for (size_t i = 0; i < n; i++) next[i] = i;
    for (size_t i = n - 1; i > 0; i--) {            // Sattolo: one big cycle
        size_t j = rand() % i, t = next[i]; next[i] = next[j]; next[j] = t;
    }
    size_t p = 0, steps = 20000000;
    double t0 = now();
    for (size_t i = 0; i < steps; i++) p = next[p];
    double s = now() - t0;
    free(next);
    if (p == (size_t)-1) puts("");                   // keep p alive
    return s / steps * 1e9;
}

int main(void) {
    size_t sizes[] = {16 << 10, 1 << 20, 64 << 20};
    const char *names[] = {"16 KB", "1 MB", "64 MB"};
    for (int i = 0; i < 3; i++)
        printf("%6s array: %5.1f ns per load\n", names[i], ns_per_load(sizes[i]));
} 16 KB array: 0.9 ns per load
1 MB array: 4.4 ns per load
64 MB array: 68.3 ns per loadLook at how the cost grows. Going from 16 KB to 1 MB makes the array 64 times bigger, and a trip gets about five times slower. Going from 1 MB to 64 MB makes it 64 times bigger again, and a trip gets about sixteen times slower. Cost doesn't grow smoothly with size. It jumps at certain sizes, which hints that something with a fixed capacity is being outgrown.
Timings change from run to run and from machine to machine. Across repeated runs the 16 KB row ranged from 0.9 to 1.9 ns and the 64 MB row between 68 and 70 ns, and a busy computer makes all three rows worse. What stays the same is the ordering and the rough size of the steps.
1.3What changed between the rows
Only the size of the array changed. The loop runs the same load every time, and nothing in the program can tell a big array from a small one. So the difference must come from how far away the numbers sit when the processor asks for them.
That raises the questions this chapter is built on. How far away can data be, and why does the processor let it be that far? What does the processor keep nearby, and how much of it? We'll start with the distance.
02Why memory is far away, and what a cache does about it
2.1The distance to main memory
Everything your program works on normally lives in main memory, which is built from chips called DRAM. They sit outside the processor, and asking them for a value takes about 83 nanoseconds. That sounds like nothing, but a core can run hundreds of instructions in that time. If every trip of our loop paid it, a million trips would take 83 milliseconds, and the core would spend nearly all of that waiting.
?Why not just make memory faster?
Over the last forty years processors got faster much more quickly than memory did. People call this gap the memory wall. Memory has improved too, but not enough to keep up, so the distance, measured in the instructions a core could have run, keeps growing.
Anyone who has worked with tools knows the problem. A pencil on your belt costs nothing to reach, the screwdriver on the workbench takes a few steps, the full set in the shed takes a walk across the yard, and the router bit in the warehouse across town takes a car trip. A good carpenter isn't faster with their hands. They keep what they use most close by.
2.2Keeping a copy nearby
A processor does the same thing. It keeps a copy of recently used data in a small, fast memory right next to the core: the cache. When a load asks for an address, the core checks the cache first. If the data is there, that is a hit, and the answer comes back quickly. If it isn't, that is a miss: the request carries on to main memory, and the data that comes back is kept in the cache for next time. A cache is small, so keeping something new means throwing something else out, called evicting it. Typically the victim is something that hasn't been used for a while.
This works because programs repeat themselves. Something you used a moment ago, you'll probably use again soon. This habit is called temporal locality. Our loop shows it clearly on the 16 KB array: that array holds 2,048 numbers and the loop makes twenty million trips, so it visits each position about ten thousand times. After the first visit, the number is in the cache, and the other ten thousand visits are hits.
2.3Levels of cache
The obvious next step is one big, fast cache, but a cache can't be both. A bigger memory takes longer to search and has to sit physically farther from the core. So chips use several caches in levels. The smallest and fastest is called L1. A larger and slower one behind it is called L2. Behind both is DRAM. A load tries each in turn and stops at the first one that has the data. A hit in L1 costs about 1.2 to 1.5 ns, a hit in L2 about 5.7 to 7.9 ns, and a trip all the way to DRAM about 83 ns.
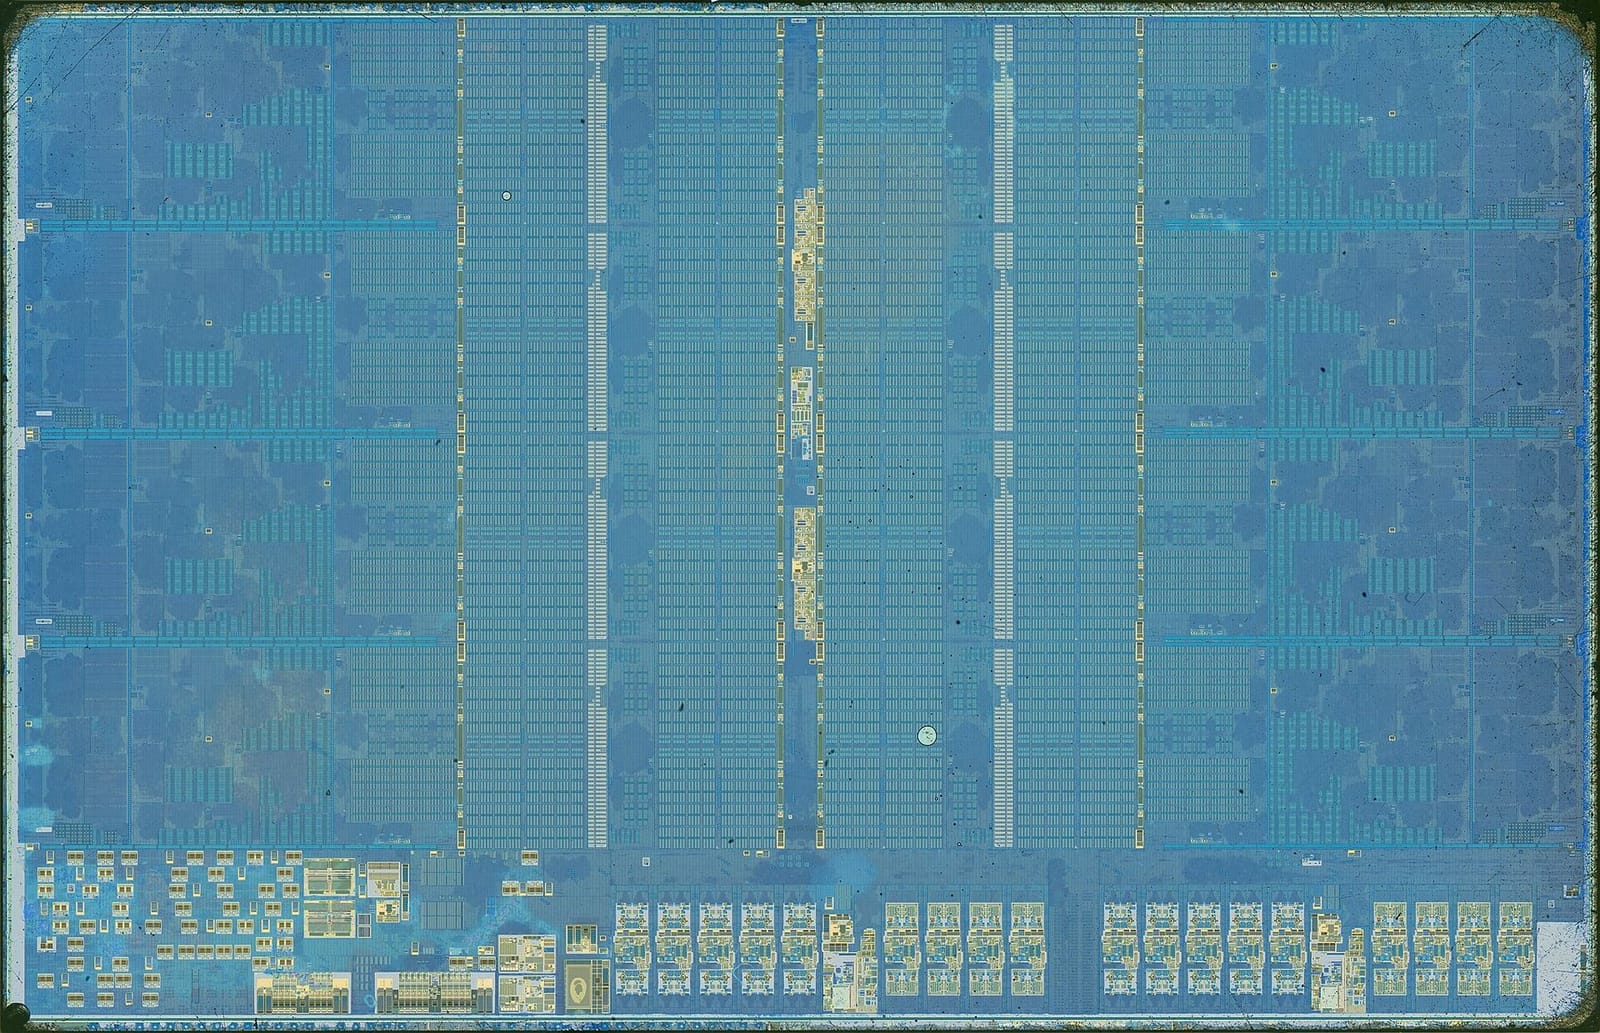
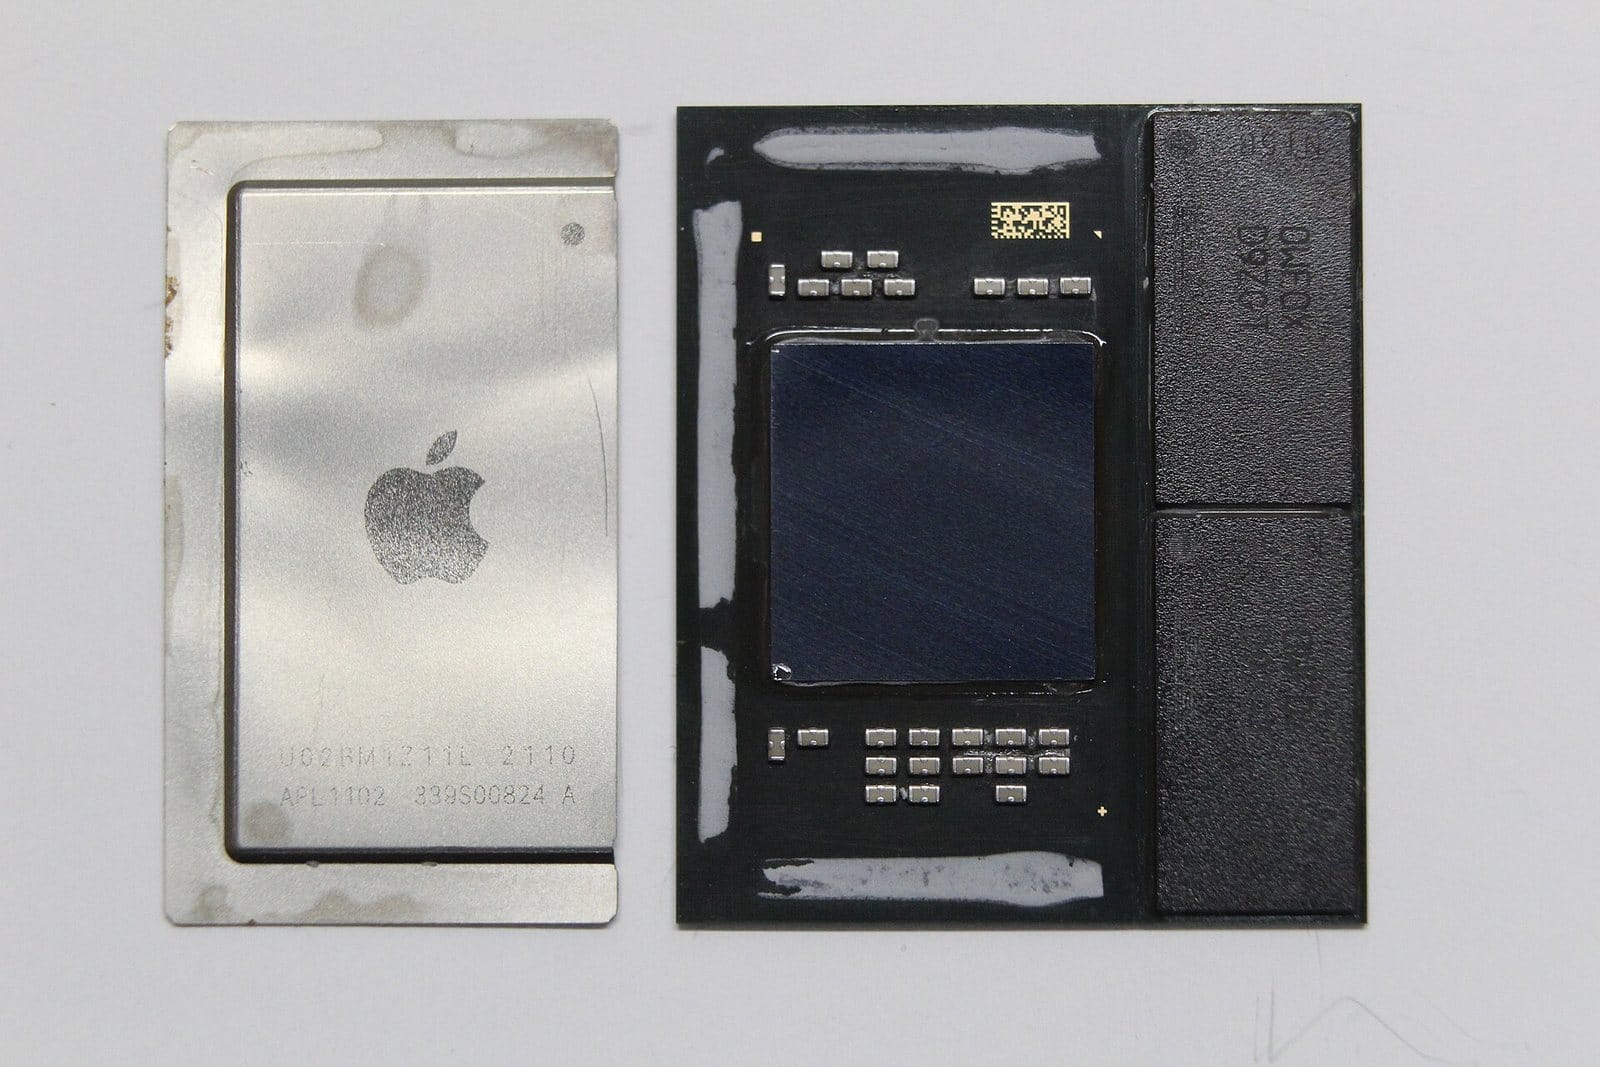
How big are these caches? It depends on the chip. The numbers in this chapter come from a recent Apple silicon laptop chip, and other chips have different sizes arranged in the same way. On a Mac the sysctl command reads them from the kernel: -n prints just the values, and hw.perflevel0 selects the chip's fast cores (Apple chips also have slower, power-saving cores with smaller caches).
sysctl -n hw.perflevel0.l1dcachesize hw.perflevel0.l2cachesize131072
16777216Those are sizes in bytes: 131,072 is 128 KB for L1's data cache, and 16,777,216 is 16 MB for L2. On Linux, lscpu shows the same information. Keep those two sizes in mind, because in 2.4 we'll hold the three arrays from section 1 up against them.
First, here is what one load looks like as it goes down through the levels. The load is next[37], the first time the loop asks for it, followed by a second load of the same entry much later. Real caches hold thousands of entries, so to watch one get thrown out we've shrunk each cache to two. The picture also moves single 8-byte entries around, which is a simplification that section 3 corrects.
next[37]. The caches hold some other entries of the array from earlier trips, but not this one, and DRAM holds the whole array.2.4The working set
What decides the cost of a load is which level holds the data, and that depends on how much memory the loop keeps touching. We call the memory a loop keeps coming back to its working set. Now the three rows of section 1 make sense. The 16 KB array fits in L1 (128 KB), so after the first visits every trip is an L1 hit, and that is the 0.9 ns row. The 1 MB array is too big for L1 and fits in L2 (16 MB), so most trips are L2 hits at a few nanoseconds. The 64 MB array is four times the size of L2, so most trips have to go out to DRAM, and the row reads 68 ns. An even bigger array, 128 MB, gets almost no help from the caches and pays about 83 ns. Section 5 sweeps through all of the sizes.
The picture showed next[37] travelling alone, and the hardware doesn't work that way. When the load misses, DRAM doesn't send back just the 8 bytes that were asked for.
03What a cache fetches
3.1A line at a time
A trip to DRAM costs 83 ns whether it brings back 8 bytes or many more, so the hardware brings back a whole block of neighbouring memory on every trip. Such a block is called a cache line. It is 128 bytes on Apple silicon and 64 bytes on most x86 chips (the Intel and AMD processors in most PCs and servers). Every cache works in lines. It fetches a line, stores a line and evicts a line, and section 6 will show that it also keeps the cores in agreement a line at a time. Even when your program reads a single byte, the cache below it moves the whole line that contains it.
sysctl -n hw.cachelinesize128On Linux the same question is getconf LEVEL1_DCACHE_LINESIZE. A line is a bet that if a program has just touched an address, it will soon touch the addresses beside it, and this habit is called spatial locality. Here are the two habits that make a cache pay off, side by side:
| Habit | What it means | Example |
|---|---|---|
| Temporal locality | Something you touched a moment ago, you'll probably touch again soon | A loop counter, a variable the loop reads on every trip |
| Spatial locality | Something next to what you touched, you'll probably touch soon too | The next element of an array |
In our array, each entry is 8 bytes, so one 128-byte line holds 16 of them: line 0 holds next[0] to next[15], line 1 holds next[16] to next[31], and so on. Suppose a different loop walks the array in order, adding the entries up. The picture below follows its first 17 loads. Watch how many of them have to go all the way to DRAM. (Real chips also have a helper that would fetch line 1 before it's asked for. We'll meet it in section 4 and leave it out here.)
next[0].Our timing loop is built to get none of that benefit. Its next position is random, so after loading line 0 for next[0] the loop will probably jump to some other line next time, and use just one 8-byte entry of the 128 bytes it just paid for, about 6%. Everything else in the line sits in the cache unused until it's evicted. Section 4 explains why that is exactly what we want when measuring latency.
3.2Paying for bytes you don't read
The flip side of fetching a line is that you pay for the whole line whether you use it or not. So your data needs a layout in which the bytes a loop reads sit close together. A struct is a record that groups several fields, and it makes a good test case.
Each element of your array is a 128-byte struct, and the loop reads one 4-byte field from each. How much of every line you pay for is useful?
Mike Acton's 2014 CppCon talk, "Data-Oriented Design and C++", made the same argument. Much C++ teaching promotes an object-oriented layout, with each object's fields stored together. That layout is hard on caches whenever a loop touches only one or two of the fields, and Acton's point was that the real job is transforming data held in contiguous arrays.
3.3Which slot a line goes in
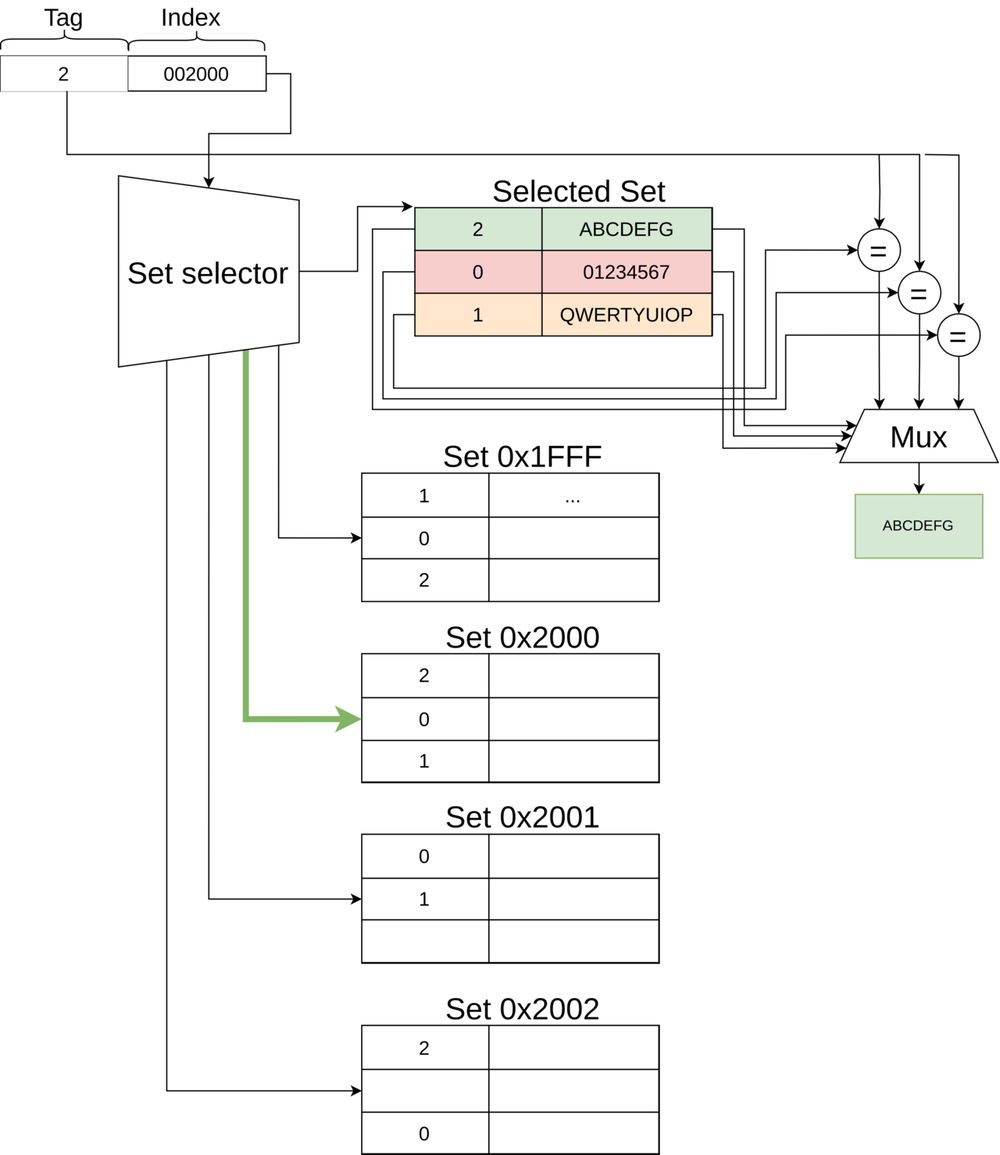
When a load arrives, the cache has to answer "do I have this line?" within a nanosecond or so, which is far too little time to search thousands of slots. So it doesn't let a line go just anywhere. The cache is divided into groups of slots, and a few bits from the middle of a line's address pick which group the line must go in. Each such group is called a set, and a set has room for only a few lines, often eight. To check for a line, the cache looks only inside its one set. A cache built this way is called set-associative. The price is that two lines whose addresses pick the same set compete for that set's few slots, even if the rest of the cache is empty.
?Why is matrix code fast at 1023×1023 and slow at 1024×1024?
A matrix is stored one row after another, so walking down a column jumps forward by one row's length each time. That jump is called the stride. Take a matrix of 4-byte numbers with 1024 per row: each row is exactly 4,096 bytes, a power of two, so every step down the column adds the same round number to the address. On a typical L1 the bits that pick the set all sit below that jump, so they never change and the whole column lands in one set. (Bigger caches have more sets, and the column then crowds into a small fraction of them instead of one.) After a handful of rows the set is full, and each new row evicts a line you're about to reuse, even though the data would fit in the cache as a whole. With 1023 numbers per row the stride is 4,092 bytes, the set bits shift as you go down, and the column spreads across the whole cache.
So the fix is to pad the row length so the stride isn't a power of two. One extra element per row looks like waste, and it is the optimisation.
Our timing loop was built to show the raw cost of a miss, and a careless benchmark can hide that cost completely. That brings us back to a question we postponed in section 1: why does each trip of the loop have to depend on the one before it?
04Measuring latency without fooling yourself
4.1Why not time a loop of independent loads?
A tempting benchmark is a loop that adds up the elements of a big array, sum += a[i], and divides the time by the number of loads. It gives a number that is far too good, and two features of the hardware are responsible.
One is out-of-order execution, from chapter 01: a core doesn't wait for a slow load to finish before it starts later instructions that don't need the result. In sum += a[i] the address of each load is just i, known in advance, so the core can launch many loads at once and let their waits overlap. Another is the prefetcher, hardware that watches the addresses a program uses and, when it sees a pattern such as "each one is next to the last", fetches the lines ahead of time. Together they make a loop of independent loads measure bandwidth, how much data per second the memory system can deliver. What we wanted was latency, how long a single request takes from the moment it's asked to the moment it's answered. In practice the two can differ by a factor of twenty.
?How does the chase stop both effects?
By making each load's address come from the previous load's value. Watch the chase from section 1 first, and then the loop that sums an array.
next[37], and it isn't cached, so the request goes out to DRAM. The value that comes back will be the address of the next load.4.2Dependent and random
The shuffled array from section 1, one random cycle through every position, does both jobs at once. Dependency defeats out-of-order overlap, because the core can't start the next load until the current one returns. Randomness defeats the prefetcher, because there's no pattern to predict. What is left is one full latency per trip, and that is why the chapter's timing loop is written the way it is.
With a loop we can trust, we can do what section 1 only hinted at: sweep the size of the array and plot the whole curve.
05The whole curve
5.1Latency against working set
Section 1 used three array sizes. Now take sixteen sizes, from 8 KB to 128 MB, with the same dependent chase through a random permutation. The vertical axis is logarithmic, so each step up is a multiplication. The numbers come from one recent laptop chip. Another chip will have its plateaus and cliffs at different sizes and heights, but the same three-step shape.
The first plateau, up to 64 KB, is L1, and the curve starts to climb at 128 KB, the size of L1 itself (section 2.3). An array exactly as big as L1 doesn't quite fit, because the program's other data needs some of the space too. A second plateau, from about 192 KB to 8 MB, is L2, and by 16 MB, the size of L2, the curve has started to rise. At 32 MB the trips take 42 ns, about halfway to DRAM, and by 64 MB the curve is on the DRAM plateau. Here are the same figures in a table:
| Working set | ns/access | Where it lives |
|---|---|---|
| 8–64 KB | 1.2 – 1.5 | L1 data cache |
| 128 KB | 2.7 | Falling out of L1 |
| 192 KB – 8 MB | 5.7 – 7.9 | L2, flat and fast |
| 16 MB | 10.6 | Edge of L2 |
| 32 MB | 42.0 | The cliff |
| 64–128 MB | 69 – 83 | DRAM |
At 64 MB the curve says 69 ns, which matches the 68 ns that the program in section 1 printed for its biggest array.
?Why are the plateaus so flat?
Within a level, every access costs about the same, so the size of the working set barely matters. Across a boundary it matters enormously. That shape is why "make the working set fit" is the highest-leverage change available, and why halving a struct can double your throughput with no algorithmic change at all.
5.2One load, sixty-eight times the cost
The curve comes from the pointer form of the same chase. Instead of the next element's position, as in chase.c, each element holds the next element's memory address, so following the chain needs no indexing at all:
void** p = (void**)a[0];
for (long i = 0; i < REPS; i++) p = (void**)*p;   // one load, repeated
Over a 64 KB working set each trip costs 1.22 ns. Over a 128 MB working set the identical loop costs 82.92 ns. That is 68 times as much, from the same instruction doing the same work, and only the size of the array moved. (The 8 KB point, at 1.48 ns, is a little slower than 64 KB, so measured from there the spread is 56 times.)
All of this describes a single core reading on its own. A modern chip has several cores, each with its own L1, and they can touch the same memory at the same time. That adds a new cost that no single-core curve shows.
06When two cores share a line
6.1Keeping the copies in agreement
Each core has its own L1. If two cores both read the same line, each ends up with its own copy, and that's fine while nobody changes anything. If one of them writes to the line, though, the other core's copy is now out of date, and it must never be read as if it were current.
Hardware keeps the copies in agreement using a coherence protocol. MESI, named after its four states, and the protocols built on it give every cached line a state in each core's cache. The rule that matters: a core wanting to write must first invalidate every other copy, which means telling the other cores to mark their copies as unusable.
| State | Meaning | Cost to write |
|---|---|---|
| Modified | This core owns it and has changed it | Free: already exclusive |
| Exclusive | Only copy, unchanged | Free |
| Shared | Several cores hold read copies | Invalidate all of them first |
| Invalid | Not here, or out of date | Fetch, possibly from another core's cache |
Reads share freely, because any number of cores can hold the line as Shared. Writes take turns, because only one core at a time can own a line.
6.2Two counters, one line
Now give our program a second job. Two threads, which are separate streams of instructions the operating system can run on different cores, run at the same time, one on core A and one on core B, and each counts events. Thread A only ever adds to a counter a, and thread B only ever adds to a counter b. They share no data. But the two counters were declared next to each other, so both sit inside the same 128-byte line, which we'll call line 5. Coherence works per line and doesn't know about variables, so it treats this as sharing. Watch what happens:
a and thread B adds to b. They share no data, but a and b sit in the same 128-byte line, line 5. At the start only memory holds it.This is called false sharing: two threads fight over a line while sharing nothing. There is no lock and no shared variable. All of the slowdown is invalidation traffic, with the line carried back and forth between two caches.
?How much does it cost?
Chapter 13 times it directly. With eight threads each incrementing their own counter, and the counters packed into one cache line, an increment took about 14.6 ns per operation. With the counters padded onto separate lines, the same threads took about 0.27 ns. That is roughly 55 times slower for work that shares no data.
This is why Java has a @Contended annotation, and why the LMAX Disruptor, a high-throughput queue library, pads its sequence counters.
To fix it in C++ you ask the compiler to start each counter on its own line, with alignas. It makes the variable begin at an address that's a multiple of the number you give it, and pads out the rest of the struct to match:
struct Counters {
    alignas(128) long a;   // starts at a multiple of 128
    alignas(128) long b;   // so a and b can never share a 128-byte line
}; // sizeof(Counters) is 256C++17 has a constant for this question, std::hardware_destructive_interference_size. It's awkward to rely on. GCC can warn when you use it, because the value gets fixed into your types at compile time and can differ between compiler settings. Apple's toolchain provides it and reports 256 for it on Apple silicon, twice the real line of 128 bytes, so using it separates the fields but wastes space. Hardcoding 64 is a portability bug that only shows up as slowness.
Both effects of this chapter are now in hand, the cost of distance and the cost of sharing. Next we'll put all the numbers in one place and work through a realistic example.
07What it all costs
7.1The numbers side by side
Every figure below was seen in an earlier section. Cache costs come from the curve in section 5, and the sharing cost from chapter 13.
A cost only matters when you can move it, and the numbers show where the room is. Within a plateau nothing much changes, so the useful move is to drop down a level.
7.2A worked example: shrinking a record
Say you have two million records, each a struct with six pointers and some flags, 64 bytes in all, and your code visits them in random order. All of them together are 128 MB, and the curve says a random access over 128 MB costs about 83 ns. Now suppose you slim the record to 16 bytes by keeping only the fields this loop needs and narrowing them, for example with 4-byte indices in place of 8-byte pointers. All of them together are now about 32 MB, and the curve says 42 ns.
| Records | your dataset | 2,000,000 |
| Bytes per record | struct with 6 pointers and flags | 64 B |
| Working set | 2M × 64 B | 128 MB |
| Latency there | from the curve | 83 ns |
| Slimmer record, 16 B | 2M × 16 B = 32 MB | 42 ns |
| a quarter of the record size, read straight off the curve | ≈ 2× faster | |
A quarter of the size bought only twice the speed, because the working set moved from the DRAM plateau to the cliff, not all the way to L2. Another step down, to a working set under 16 MB, would move you to the 10 ns region on the curve. This estimate holds for random access, the kind the curve measures. A sequential scan would behave very differently, because the prefetcher would hide most of the latency.
7.3What you can change
Five things decide the numbers above, and you control only some of them.
| Variable | Effect | Can you reach it? |
|---|---|---|
| Working set size | Decides which plateau you sit on. Dominates everything. | Yes: shrink the struct, narrow the types |
| Access pattern | Sequential gets the prefetcher; random does not | Yes: contiguous layout, indices not pointers |
| Sharing between threads | A line that both threads write makes their cores take turns | Yes: pad with alignas |
| Cache line size | The granularity of everything above | No. Query it, never assume 64. |
| Associativity | Power-of-two strides can alias into one set | Indirectly: pad the row length |
Three of these are yours, and the first is usually worth more than the other four put together. Moving left on the curve beats most micro-optimisations. Next we'll turn that into rules and see how to check each one on a running program.
08Checking it on a real program
8.1Commands
Each question this chapter raised has a command that answers it.
# How big are my cache lines and caches? (sections 2 and 3)
sysctl -n hw.cachelinesize          # macOS
getconf LEVEL1_DCACHE_LINESIZE      # Linux
lscpu | grep -i cache               # Linux: the size of every cache level
sysctl -a | grep cachesize          # macOS: every cache size

# Is this program waiting on memory, and at which level? (section 5)
perf stat -e cache-references,cache-misses,LLC-load-misses ./app
perf record -e cache-misses -g ./app && perf report

# How big is each struct, and where is the padding? (sections 3.2 and 6.2)
pahole -C YourStruct ./app
perf is a Linux profiler. perf stat counts how often the program asked a cache for data and how often it missed, and LLC means the last-level cache, the last one before DRAM. If the miss count is a large share of the references, your working set is outgrowing the caches. perf record then shows which lines of code the misses come from. pahole prints every field of a struct with its offset and any padding holes, so you can see how many bytes a record occupies and whether two hot fields share a line.
8.2Rules that hold up
- Make it smaller. Shrink structs, use narrower types, drop padding, and replace 8-byte pointers with 4-byte indices. This moves you left on the curve, and the curve is steep.
- Make it contiguous. Go from an array of structs to a struct of arrays when a loop touches only some of the fields. Sequential access recruits the prefetcher, which makes the difference between the curve above and a much flatter one.
- Make it unshared. Pad anything two threads write with
alignas, using your platform's real line size. A factor of about 55 is waiting otherwise. - Query the line size. Padding to 64 on a 128-byte-line machine fixes nothing.
- Measure latency with a dependent, random chase. Independent or sequential loads measure bandwidth and the prefetcher.
8.3What you trade for what
| You get | You pay | When the bill arrives |
|---|---|---|
| A smaller working set from narrower types and indices | An index has to be looked up in an array where a pointer could be followed directly | When you need to restructure or debug the data |
| Contiguous layout and a prefetcher that helps | Inserting or removing in the middle of an array moves data | When the workload is mostly inserts and deletes |
| Padding that ends false sharing | Each padded variable takes a whole line of memory | When there are millions of padded objects |
| Caches that make most loads cheap | A miss still costs the full trip to DRAM | As a latency spike when the working set grows past a plateau |
8.4Symptom, cause, fix
| Symptom | Likely cause | Fix |
|---|---|---|
| Gets much slower past a certain data size | Working set fell off a plateau | Shrink records, narrower types, indices not pointers |
| A linked structure is slow; an array of the same data is fast | Dependent loads to scattered nodes | Contiguous layout |
| Threads writing separate variables scale badly | False sharing | Pad to the real line size with alignas |
| Padding to 64 bytes didn't help on an M-series Mac | Lines are 128 bytes there | Query the line size |
| Fast at 1023×1023, slow at 1024×1024 | Power-of-two stride aliasing into one set | Pad the row length |
| Latency benchmark looks twenty times too good | Measuring bandwidth, not latency | Chase a random permutation |
09Summary
- The same load can cost about 1 ns or about 70 ns. In the loop from section 1 only the size of the array changed.
- Main memory is far from the core. A load that goes to DRAM takes about 83 ns, long enough for the core to run hundreds of instructions.
- Caches work because programs repeat themselves. They reuse what they just touched and touch what is next to it.
- The working set decides which level serves a load. L1 hits cost 1.2 to 1.5 ns and L2 hits 5.7 to 7.9 ns, and past L2 the trips go to DRAM.
- Caches move lines, not bytes. A line is 128 bytes on Apple silicon and 64 on most x86, and a walk in order misses once per 16 eight-byte entries.
- You pay for the whole line. Reading one 4-byte field from each 128-byte struct uses about 3% of what was fetched.
- Latency needs a dependent, random chase. Independent or sequential loads measure bandwidth and the prefetcher instead.
- The curve has plateaus and cliffs. One instruction cost 1.22 ns at 64 KB and 82.92 ns at 128 MB, a factor of 68.
- Writes need exclusive ownership. Coherence invalidates every other copy of a line before a core can write it.
- False sharing is contention over no shared data. 14.6 ns against 0.27 ns padded, about 55 times across eight threads. Padding only helps at the real line size, so query it rather than assuming 64.
- Shrinking the working set beats most micro-optimisations. A record a quarter of the size roughly halved the latency in the worked example, straight off the curve.
10Build this
Measure your own curve. Forty lines, and you'll use the result for years.
- Build a random permutation of pointers linked into one cycle, for working sets from 4 KB to 256 MB.
- Chase it. Plot ns per access against size, with a log x-axis.
- Read your cache sizes off the cliffs, then check them against
sysctl -a | grep cachesizeorlscpu.
Then run it again with a sequential permutation instead of a random one and watch the whole curve flatten. That second run is the prefetcher, and seeing its effect as a before-and-after teaches more than any description.
11Interview questions
beginnerWhy is iterating an array faster than a linked list with the same elements?›
Two reasons, the second mattering more. An array is contiguous, so each line fetch brings several elements you're about to use. And the addresses are predictable, so the prefetcher loads them before you ask.
A linked list needs a dependent load per node, because you can't compute the next address until the current one arrives, and the nodes may be scattered. Past cache size that is the difference between roughly 1 ns and 80 ns per step.
intermediateHow would you measure memory latency, and what's the trap?›
Chase pointers through a random permutation sized to the level you're probing. Each load's address comes from the previous load's value, so one miss is outstanding at a time and the prefetcher has nothing to predict.
The trap is measuring independent loads. Then the core issues many concurrently and you end up measuring bandwidth, a different property, which can come out twenty times better than the latency.
intermediateWhat is false sharing and how do you fix it?›
Two threads write different variables that sit in one cache line. Coherence works per line, so each write invalidates the other core's copy and the cores take turns, even though no data is shared.
Pad each variable onto its own line with alignas, using the real line size. It is 128 bytes on Apple silicon and 64 on x86-64, so padding to 64 on an M-series chip fixes nothing. Chapter 13 puts the penalty at about 55 times across eight threads.
deepAn O(n log n) algorithm is losing to an O(n²) one on real data. How?›
Constant factors, specifically cache behaviour. If the n² version walks contiguous memory and the n log n version chases pointers, each step of the better algorithm can cost far more. A dependent access that stays in L1 takes about 1.22 ns, and one over a 128 MB working set takes about 82.92 ns, roughly seventy times as much.
Asymptotic analysis assumes every access costs the same. That has not been true for decades, and the gap widens with every generation of hardware.
deepYour matrix code is fast at 1023×1023 and slow at 1024×1024. Explain.›
Cache set aliasing. Caches are set-associative and the set index comes from the middle bits of the address. With a power-of-two row stride, the same column across many rows maps to one set, so you exhaust its associativity and evict lines you're about to reuse, even though the data would fit in the cache.
Pad the row length so the stride isn't a power of two. One extra element per row looks like waste, and it's the optimisation.
12Go deeper
Roughly how much slower is DRAM than L1?›
Around 60 to 70 times: about 1.22 ns for a dependent load that hits L1 against about 82.92 ns at a 128 MB working set. It is the same instruction, and only the working set differs.
You pad a struct to 64 bytes on an M-series Mac. Did it stop false sharing?›
No. Lines are 128 bytes there, so two fields padded 64 bytes apart can still share one. Query the size instead of assuming it.
Why does a benchmark of independent loads not measure latency?›
The core issues many at once and the prefetcher runs ahead, so you measure bandwidth. Latency needs a dependent chain.
Your working set is 20 MB and random access is slow. Cheapest fix?›
Make it smaller. Getting under about 16 MB moves you from about 42 ns to about 10 ns on the curve in section 5, with no algorithmic change.
From 2007 and still definitive. Numbers have moved; every mechanism it describes has not.
Abrasive, correct, and the clearest argument that layout is the optimisation and everything else is detail.
Seven short experiments, each isolating one behaviour. Best hands-on introduction there is.
Production tools for exactly the curve in section 5, if you'd rather not write your own.
13Related chapters
The out-of-order core that independent loads keep busy, and the IPC check that points you here. Chapter 01.
Store buffers, and what another thread is allowed to see when lines move between cores. Chapter 03.
Where the 55× false-sharing measurement comes from. Chapter 13.