Suppose a small piece of your code does 10 milliseconds of real computing, say the work needed to answer one web request. That's 10 ms of CPU time, time spent executing your instructions. On a machine with nothing else to do, it finishes in about 10 milliseconds. Run the same code on a busy server, or inside a container with a CPU limit, and the very same work can take 34 milliseconds, or 100. There's no bug in it and no error anywhere. The program is waiting its turn, and nothing on screen says so.
Your code isn't alone on the machine, and that explains it. A core is the part of a processor that executes instructions, and it follows one stream of them at a time. A laptop has around ten cores and is looking after hundreds of programs. Picture one cook in a kitchen with forty orders on the rail. Nobody waiting believes they've been forgotten, because the cook keeps every dish moving: chop for a minute, put a pot on to simmer, start a sauce while it heats, come back when something needs attention. Every program on your computer believes it has a core to itself, the way every customer believes the cook is working on their dish.
Keeping that belief alive is the job of the kernel, the central part of the operating system, which runs with full control of the hardware. The piece of the kernel that decides which program gets a core, and for how long, is the scheduler. This chapter asks one question about it: when my code needs 10 ms of CPU, why can it take 34 ms or 100, and what can I do about it? We'll start by counting what your own machine is juggling, then share one core between four threads by hand, and end with the container CPU limit that can freeze a program that's barely using the CPU.
01Your machine, right now
1.1How many programs, how many cores
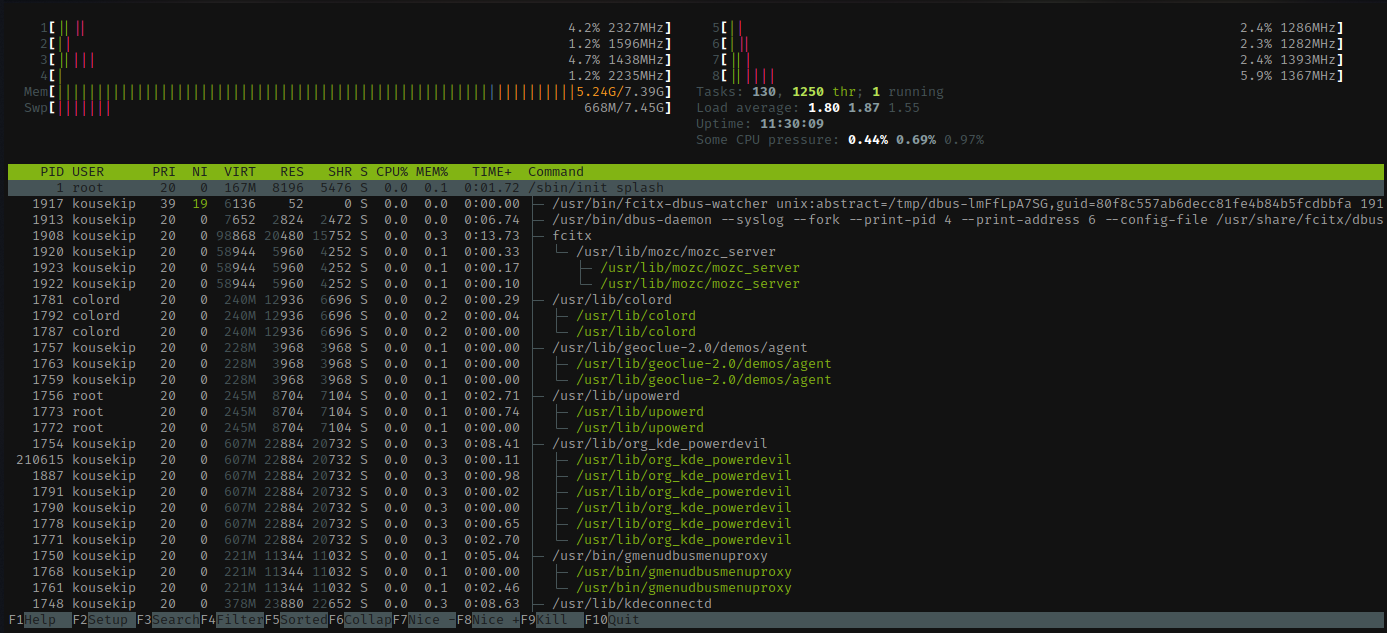
Before any theory, let's see how lopsided the numbers are on your own machine. Open a terminal; nothing here needs setup. The first command, ps -A, lists every program the operating system is currently running, one per line, and wc -l counts the lines. The second, sysctl -n hw.ncpu, prints the number of cores (on Linux the same job is done by nproc). The third asks ps for just the state of each program, a one-letter code for what it's doing right now, and the awk part skips the header line and counts how many programs have each first letter.
ps -A | wc -l                                   # every process on the machine
sysctl -n hw.ncpu                               # cores (on Linux: nproc)
ps -Ao state | awk 'NR>1{c[substr($1,1,1)]++} END{for(k in c) print k, c[k]}' 716
10
R 2
S 713Line one says 716, but that includes the header line ps prints, so there are 715 programs sharing 10 cores. The letters count them by state: R is running, meaning on a core at the moment ps looked, and S is sleeping. In this output 2 were running and 713 were sleeping. One of the two running ones is very likely the ps command itself, which was on a core while it counted everyone else. Your numbers will differ, but run the commands a few times: the number running barely moves, however busy the machine feels.
1.2What that tells you
A sleeping program is waiting for something: a keypress, a network packet, a timer, a disk. While it waits it isn't on a core, and the kernel just keeps a note of what it's waiting for and skips it until that thing happens. It costs almost nothing, which is how ten cores can look after hundreds of programs.
Trouble starts when more programs want to run than there are cores. Then the kernel has to choose, and every choice makes somebody wait. Before we can watch it choose, we need to be exact about what those 715 things are, because the word "program" isn't quite right.
02Processes and threads
2.1A program that's running
A program is a file on disk: instructions and nothing else. When you run it, the kernel creates a process. The process gets an address space, its own private view of memory (chapter 04 explains how that's built), a table of the files it has open, an owner whose permissions it runs with, and at least one thread to execute its code.
A thread is one line of execution, with its own registers and its own stack. The registers are the core's handful of fastest storage slots, holding the values it's working on right now, and the stack is the memory where a thread's function calls keep their local variables. The core runs threads. The process is the setting they run in: the memory, open files and permissions that all its threads share. On our machine the scheduler is juggling at least 715 threads, one for every process, and from here on the thing we care about is one thread that needs 10 ms of CPU.
2.2Where processes come from
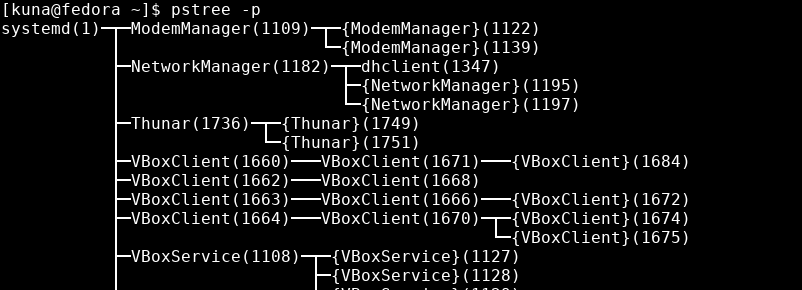
On Unix, a new process is made by an existing one, with an oddly simple pair of calls. fork() clones the calling process, and the child starts as a near-exact copy of its parent. waitpid() lets the parent pause until the child finishes. The script below forks once. The child prints its own pid (the number the kernel gives each process) and its parent's, then exits at once. The parent waits for it and prints its own pid. The flush=True makes Python write each line immediately, because the child's os._exit skips Python's usual clean-up and would otherwise lose the line.
import os
pid = os.fork()
if pid == 0:
    print("child  pid", os.getpid(), "parent", os.getppid(), flush=True)
    os._exit(0)
os.waitpid(pid, 0)
print("parent pid", os.getpid(), flush=True)child pid 83340 parent 83339
parent pid 83339In the output the child reports the parent's pid as its own parent, so the two lines show one family. Each run prints different numbers. Notice the if pid == 0 line: fork() returns twice, once in each process. In the parent it returns the child's pid, and in the child it returns 0, so that one test is how the same code tells the two copies apart.
?Doesn't copying a whole process take forever?
It would, if the kernel copied the memory. It doesn't. Memory is handed out in pages, chunks of usually 4 KB (chapter 04). After a fork, parent and child share the same pages of real memory until one of them writes to one, and only then does the kernel copy that single page. This is copy-on-write, and it's why Redis can snapshot a 50 GB dataset with fork(). Chapter 04 walks through it.
To run a different program, the child calls exec(), which replaces its contents with the new program: same process, new code. That's all a shell does. When you type ls, the shell forks itself, the child execs ls, and the shell waits. A shell is fork, exec and wait in a loop.
What happens to the child in the moment between its exit and the parent's waitpid? The parent may want to ask how the child ended, its exit status, so the kernel can't forget the child completely. It keeps a small record until the parent collects it, and a child in that state is a zombie. The next script makes one on purpose. It forks a child that exits immediately, gives the child 0.2 seconds to do so, and uses ps -o pid,stat,comm -p PID to show three columns (the pid, the state letter and the command name) for that one process. Then the parent calls waitpid and looks again.
import os, subprocess, time
pid = os.fork()
if pid == 0:
    os._exit(0)                      # the child exits at once
time.sleep(0.2)                      # the parent has not called waitpid yet
print(subprocess.run(["ps", "-o", "pid,stat,comm", "-p", str(pid)],
                     capture_output=True, text=True).stdout, end="")
os.waitpid(pid, 0)                   # now the parent collects the exit status
r = subprocess.run(["ps", "-o", "pid,stat,comm", "-p", str(pid)],
                   capture_output=True, text=True)
print("after waitpid:", "gone" if r.returncode else r.stdout) PID STAT COMM
36433 Z <defunct>
after waitpid: goneIn the output the state letter is Z and the command shows as <defunct>: the child has finished and uses no CPU, and only its record is left. Once waitpid has run, the record is gone. A zombie costs one slot in the kernel's table of processes, which is harmless for one and a slow leak for a long-running parent that forgets to wait for thousands of children.
2.3Thread or process?
Both threads and processes are things the scheduler can run. What differs is what they share. Threads in one process share its address space, its open files (each one named by a small number called a file descriptor) and its signal handlers. A signal is a short notice the kernel delivers to a process, such as the one you send by pressing Ctrl-C, and a signal handler is the function the process has chosen to run when one arrives. Separate processes share none of that by default.
| Threads in one process | Separate processes | |
|---|---|---|
| Share | Address space, file descriptors, signal handlers | Nothing by default |
| Creating one | Cheaper | More expensive |
| A crash | Takes the whole process with it | Stays inside that process |
| Scheduling | Almost identical | Almost identical |
Scheduling works the same way for both, and it's the part we haven't met yet: there are hundreds of threads and ten cores. Let's start with one core and four threads, since that's small enough to draw.
03Sharing one core
3.1Run to completion, and what breaks
Our toy machine has a single core and four threads, A, B, C and D, each needing 10 ms of CPU. What's the simplest thing the kernel could do? Run A until it finishes, then B, then C, then D. Two things go wrong at once.
- A thread that waits wastes the core. Say A stops to read from disk. Nothing else can use the core until A's read comes back, so it sits idle for the whole wait, even though B, C and D are ready to go.
- A thread that never finishes blocks everyone. If A gets stuck in a loop, B, C and D never run at all.
Fixing the first problem needs a way to switch away from a thread that can't continue. Fixing the second needs a way to take the core back from a thread that won't give it up.
3.2Switching, and taking the core back
To switch away from a thread, the kernel saves everything the core was holding for it, so the thread can carry on later as if nothing had happened. That's its registers, its stack pointer (which says where the thread's stack currently ends), and the point it had reached in the code. Then the kernel loads the same things for another thread. Saving one thread's state and loading another's is called a context switch.
To take the core back, the kernel needs help from the hardware. A timer fires every few milliseconds, and each time it does, it causes an interrupt: the core stops what it's doing, whatever that is, and jumps into the kernel. Now the kernel gets a chance to decide that the running thread has had enough and give the core to someone else. Taking the core away from a thread that's still running is preemption. The time a thread may hold the core before it's due for preemption is its time slice. And the part of the kernel that decides who runs next is the scheduler we met in the opening.
3.3The states of a thread
With switching and preemption in place, a thread is always in one of five states. It is new while it's being created and exited once it has finished. In between, it's either on a core, waiting for a core, or waiting for something else, and the scheduler's job is to move it between those three. Here are our four threads going through them, with one twist: B has to read a file from disk.
That's the life of every thread, from creation to exit. The table lists every move it can make, including the two the picture skipped: from new into the run queue, and out to exited. In the table, I/O means input and output such as disk and network reads, and a lock is something a thread holds so that others can't touch the same data at the same time (chapter 13). Languages and kernels name and split these states differently (Java's thread API exposes six, and Go hides them behind goroutines, its own lighter-weight threads), but each of them refines this picture.
| From | To | Because |
|---|---|---|
| New | Runnable | The thread is started |
| Runnable | Running | The scheduler picks it |
| Running | Runnable | Its time slice ran out (preemption) |
| Running | Blocked | It waits on I/O, a lock or a timer |
| Blocked | Runnable | What it waited for is ready. It doesn't run yet |
| Running | Exited | It finishes |
Look for the move that's missing. Nothing goes straight from Blocked to Running: a woken thread always queues for a core first. That queue is where the next section's numbers come from.
04Four threads, one core
4.1Work it out with 4 ms slices
Let's put numbers on that queue. Same toy machine: one core, four runnable threads, each needing 10 ms of CPU. The scheduler hands out 4 ms slices in turn, and to keep the arithmetic clean we'll pretend a context switch takes no time (section 6 puts the cost back).
One core, four threads, each needing 10 ms of CPU, 4 ms slices in turn. When does the first thread finish?
Step through the slices and watch the numbers on each thread.
Every thread needed 10 ms of work and took more than three times that. This waiting in the run queue is where the 34 ms of the opening comes from.
?If sharing makes everyone slower, why share at all?
Run to completion would have finished A, B, C and D at 10, 20, 30 and 40 ms. That's earlier than 34, 36 and 38 for the first three, and the same 40 for D. Time slicing doesn't make anything finish sooner. What it buys is a machine that never stalls: a thread that blocks on the disk hands over the core at once, a thread that loops forever can't lock the others out, and in a real system a thread that has just woken to handle a keypress gets a turn within a few milliseconds instead of waiting for a long job to end.
4.2Why a profile can't see waiting
Think about what a profiler would say about thread A. A CPU profile samples, many times a second, which function each core is executing, and adds up how long each one was on a core. It's often drawn as a flame graph, a chart of stacked bars in which a wider bar means more time on a core. A was on the core for exactly 10 ms of its 34, so the profile shows 10 ms of work and nothing else. The other 24 ms don't appear, because a runnable thread isn't executing anything for the profiler to catch.
?Where does that waiting show up, then?
It shows up in latency, the time one piece of work takes from start to finish. Compare that with throughput, how much work gets finished per second, which here is perfect: the core did 40 ms of work in 40 ms. Services usually track the slow end of latency, such as the p99 latency, the time that 99 out of 100 requests beat. A service's p99 can double while its CPU graph sits at 60%, and runnable time is usually where the missing milliseconds are.
So each of the three middle states needs its own way of being seen. Running time is what a profile shows. Runnable time shows up in the run queue depth, the number of threads that are runnable at a moment, and in little else. Blocked time needs off-CPU analysis, which records where threads went to sleep and for how long, instead of where they ran:
| State | Meaning | Shows up in |
|---|---|---|
| Running | On a core right now | CPU profiles, flame graphs |
| Runnable | Ready, waiting for a core | Run queue depth. Almost nothing else. |
| Blocked | Waiting on I/O, a lock, a timer | Off-CPU analysis only |
We assumed the scheduler hands out equal 4 ms slices in a fixed turn order. Real schedulers promise less than that and work harder.
05How Linux picks the next thread
5.1Eventually, and nothing more
Our toy scheduler promised a lot: equal 4 ms slices, in a fixed order, so you could work out to the millisecond when A would finish. A real scheduler promises much less, and less than most people design against: every runnable thread eventually runs. That's close to the entire guarantee. It says nothing about when your thread runs, for how long, or on which core, and on a machine with fast and slow cores it doesn't even promise that the cores are equivalent.
Anything your design needs beyond "eventually" has to come from somewhere else. There are three places to look. A thread's priority tells the scheduler how much it matters. Affinity pins a thread to particular cores. And a real-time class is a separate set of scheduling rules, and any runnable thread placed in it runs before every ordinary thread.
5.2From CFS to EEVDF
Let's see how Linux decides, starting from our toy. All four threads are equal, so each is owed a quarter of the core, and the equal 4 ms turns we drew give exactly that. But threads aren't always equal. A user can lower a thread's importance with the nice command, which sets its nice value, a number from −20 to 19 where a higher number means "be nicer to everyone else". The kernel turns the nice value into a weight, and a lower nice value means a bigger weight. The scheduler's goal is then fair share: each runnable thread gets CPU time in proportion to its weight.
Linux ran a scheduler called CFS (the Completely Fair Scheduler) on that principle for about fifteen years. In version 6.6 it was replaced by EEVDF, Peter Zijlstra's rewrite. Both aim at the same fair share. CFS tracks how much CPU time each thread has had, scaled by its weight, and picks the thread furthest behind its share. EEVDF also tracks each thread's lag, how much CPU time it's owed (or has been given too much of), and gives it a deadline, the point by which its next slice should be done. A thread that's owed time is eligible, and among eligible threads EEVDF picks the one with the earliest deadline.
| CFS | EEVDF (Linux 6.6+) | |
|---|---|---|
| Goal | Fair share by weight | Fair share by weight |
| Weight comes from | Nice value | Nice value |
| Tracks | Each thread's share of CPU time | Also lag (how far a thread is from its fair share) and a deadline |
| Picks | The thread furthest behind on its share | Among threads owed time, the one with the earliest deadline |
In practice EEVDF improves latency for threads that sleep most of the time and wake rarely. That covers most interactive work, and most I/O-bound work, meaning work that spends its time waiting for disks and networks rather than computing. To see which scheduler you're on, run uname -r, which prints the kernel version: 6.6 or newer means EEVDF. Latency for those rarely-waking threads changed noticeably between the two, so check the version before you compare numbers across machines.
?Does fair share guarantee my thread a slice?
No. Fair share is a target the scheduler converges toward over time. It says nothing about any individual slice, and a thread that's owed time may still wait behind others for its turn.
5.3Cores that aren't equal
So far every core was the same. Many recent processors aren't built that way: they mix performance cores, which run fast and use more power, with efficiency cores, which run slower and sip power. Every recent phone does this, Apple's laptop chips do, and so do Intel's P/E designs. The scheduler places threads using their utilisation history and the chip's thermal state, and the same thread can run at very different speeds depending on where it lands.
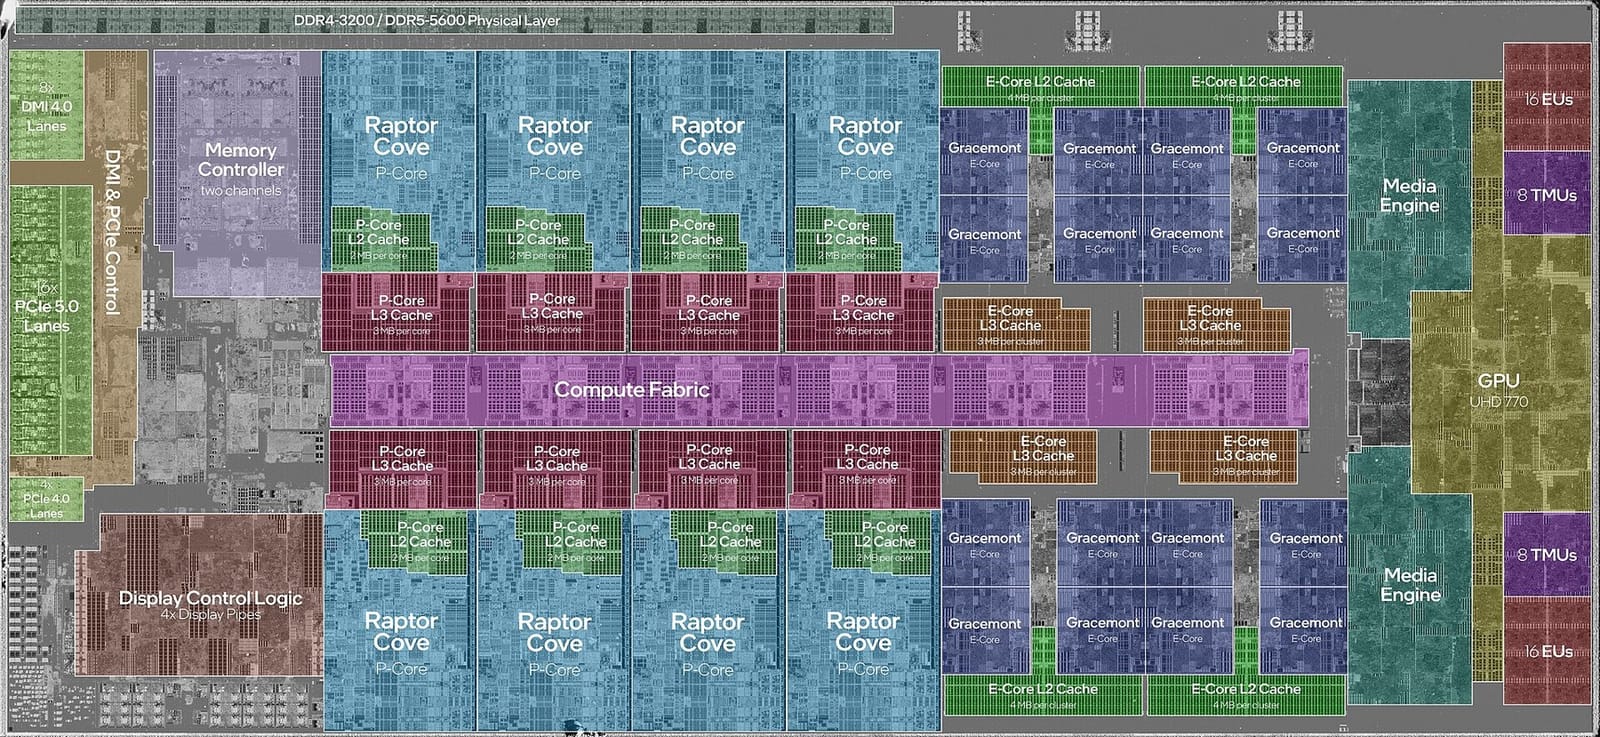
That breaks a background assumption in almost every benchmark: that threads are interchangeable. Section 8 shows it in numbers, where going from one thread to five gives 4.3× the speed instead of the 5× you'd expect, probably because those five didn't all get equal hardware.
We've also been ignoring something. Every time the scheduler swaps one thread for another, the core has to do the swap, and we pretended that was free.
06What a switch costs
6.1What the kernel saves and swaps
A context switch is the moment the scheduler's decision takes effect, and the save and restore of registers are the cheap part of it. To see where the cost is, follow one switch from A to B, where B belongs to a different process. Three things from earlier chapters come into it. A process's page table is the map the hardware uses to turn that process's addresses into real memory locations (chapter 04). The TLB is a small store inside the core that remembers recent translations, so most lookups skip the map (also chapter 04). And the caches are small, fast memories next to the core that hold copies of recently used data, because fetching from main memory takes many times longer (chapter 02).
?Why is a thread switch cheaper than a process switch?
Because of the fourth frame. Switching between threads of one process means saving and restoring registers and the stack pointer, and the page table stays the same. Switching between processes also swaps the page table root, which makes much of what the TLB holds useless and leaves it to be refilled from scratch. (Many processors tag TLB entries with the address space they belong to, so some survive, but the new thread still has to load the translations it needs.)
The same cost turns up somewhere you might not expect. A system call is a request from a program to the kernel, such as "read this file" (chapter 07), and it switches into the kernel and back without changing threads at all. Even so, the 2018 fixes for the Meltdown processor flaw made every system call more expensive on the processors that needed them. Their main part, page table isolation, unmaps most of the kernel from a process's page table while it runs its own code, so entering the kernel has to switch page tables, and that brings back part of this cost on every kernel entry.
6.2The cost you cannot see in the switch
If you time only the save, swap and restore, you undercount what a switch costs. The incoming thread finds caches full of somebody else's data and, after a process switch, a TLB that no longer describes its address space. The refills happen after the switch completes, they're charged to your thread's run time, and they can cost far more than the switch did. On our toy machine, each of the eleven switches in section 4 would have paid this on top of the switch itself.
Chapter 16 shows where this hurts most. In a convoy, many threads wake one after another, often to take turns with the same lock, and each pays its own re-warming cost, so the total grows well beyond what the handoffs alone would suggest.
Everything so far has treated fairness as the scheduler's only rule. Inside a container there's a second rule that has nothing to do with fairness, and it can stop every thread you own at once.
07Where scheduling goes wrong
That second rule is the container CPU limit. It's the first of three ways scheduling goes wrong in this section, and all three have something in common: from inside the application, each looks like something else. The CPU limit comes first because it's the most common in services that run in containers.
7.1Throttled at 30% CPU
A container is a group of processes the kernel has boxed in with limits on what they can use (chapter 11 builds one). The kernel feature that does the counting and the boxing is the cgroup, short for control group. When you give a container a CPU limit of 0.5, it feels natural to read that as "half a core, all the time". The kernel doesn't enforce it that way. It enforces a quota over a period, 100 ms by default: a container with a 0.5 CPU limit gets 50 ms of CPU to spend in every 100 ms window. On cgroup v2 that limit is a line in the file cpu.max, and 50000 100000 means 50,000 microseconds per 100,000.
Take a single busy thread under that limit. It runs for 50 ms, spends the whole quota, and is frozen for the other 50 ms. Now give the container several busy threads, the way a multi-threaded runtime does, and it gets worse, because the quota is a pool of CPU time that every thread draws from at once. Here is our 10 ms request again, arriving as a burst of eight, with eight worker threads on eight free cores:
?Why does average CPU look fine?
Because the average includes the frozen time. The container used its 50 ms in a burst, then did nothing for the rest of the period, so a per-second graph shows modest usage. That's why a service can show 30% CPU and still be throttled. The symptoms are distinctive once you know them:
| Symptom | What it means |
|---|---|
| p99 latency in clean multiples of 100 ms | Each stall lasts until the end of a quota period |
| Average CPU usage well under the limit | The average includes the frozen time |
| No application-level explanation | The whole cgroup was paused, not your code |
Check nr_throttled and throttled_usec in the container's cpu.stat (on cgroup v1 the second counter is called throttled_time, and counts nanoseconds). This is probably the most under-diagnosed latency problem in containerised services, and the throttling field note reproduces it.
7.2Oversubscription and priority inversion
Throttling keeps threads that want to run off the cores. A quieter version of the same problem needs no limit at all. When a program has more runnable threads than there are cores, it's oversubscribed, and the cores have to time-slice between them exactly as our toy core did in section 4. Each thread's latency grows with the number of threads ahead of it in the queue, while throughput may not change at all. Section 8 measures the point where adding threads stops helping.
A second problem comes from priorities. Chapter 13 covers it in full, but notice what nice does on Linux: it only changes the fair-share weight. A thread at nice 19, the lowest priority, still runs, and it still holds any lock it took. Because it gets only a small share of the core, it may take a long time to reach the point where it lets the lock go. A high-priority thread that needs the same lock now waits on the low-priority one, and that reversal is priority inversion.
7.3Thundering herds
The third problem comes from waking too many threads. Suppose a hundred threads are blocked, waiting for work, and one job arrives. If the kernel wakes all hundred, each one moves to the run queue, waits for a core, gets switched in, and checks for the job. One of them takes it, and the other ninety-nine find nothing and go back to sleep. Every one of those wasted wakeups paid for a trip through the run queue and a context switch, with the cache refills from section 6. This is a thundering herd.
The usual interfaces let you wake just one. epoll, the Linux call that waits on many network connections at once, has a flag, EPOLLEXCLUSIVE, for that. A futex is the kernel's wait-and-wake mechanism that locks are built on, and its FUTEX_WAKE operation takes a count of how many waiters to wake. A condition variable, the standard way for a thread to sleep until another thread tells it something has changed, offers notify_one alongside notify_all for the same reason.
So how many threads is too many, and what does having them cost? That takes numbers.
08What threads cost
8.1Creating a thread, and handing work to one
A server that handles each request on its own thread has two ways to get that thread. It can create a new one for every request, or it can keep a thread pool, a set of threads created once and kept waiting, and hand each request to one of them. So we want two numbers: what it costs to create a thread, and what it costs to pass work to one that already exists.
The table has three measurements. The first creates a thread and joins it, which means waiting for it to finish. The second passes a value back and forth between two running threads through a shared variable (an atomic, from chapter 03), with neither thread going to sleep. The third is sched_yield(), the call a thread makes to offer its core to another runnable thread. With nobody else waiting, it measures the bare cost of asking the scheduler.
Creation is about 127 times a round trip, and that ratio is the argument for thread pools. Put it to work on a realistic load. Say a server gets 10,000 requests a second and either starts a new thread for each one or hands each request to a thread from a pool:
| Requests per second | target | 10,000 |
| A new thread per request | 10,000 × 13.8 µs | 138 ms/s |
| Share of one core spent creating threads | 138 ms of every 1,000 | 13.8% |
| A pool, one handoff per request | 10,000 × 109 ns | 1.1 ms/s |
| why servers keep a pool of threads | 13.8% → 0.1% | |
The pool's row is a best case. The 109 ns round trip had both threads awake on their own cores, and a real pool worker is often blocked, waiting for work, so handing it a request also means waking it and switching it onto a core. That costs more than 109 ns, but it doesn't change which side of the comparison wins. Chapter 15 works the thread-pool trade-off through in full.
8.2Where adding threads stops helping
Now the other half of section 7.2: how many threads is too many? Take a fixed amount of CPU-bound work, work that only computes and never waits for a disk or network. Here it's 40 million multiply-adds (multiply two numbers, add the result to a running total). Split it across more and more threads on a ten-core laptop chip that has four performance cores and six efficiency cores, and record the wall time, the time that passes on the clock until all the work is done. We'll define speedup as the one-thread time divided by the time with more threads, so a speedup of 4 means four times faster.
With 10 threads on 10 cores the work takes about 4.4 ms. About how long does it take with 40 threads on the same 10 cores?
| Threads | Wall time | Speedup | Reading |
|---|---|---|---|
| 1 | 36.29 ms | 1.0× | Baseline, one core |
| 5 | 8.46 ms | 4.3× | Not 5×; see below |
| 10 | 4.40 ms | 8.2× | All ten cores, not 10× |
| 20 | 4.42 ms | 8.2× | Oversubscribed. No gain. |
| 40 | 4.45 ms | 8.2× | Still no gain, and no collapse. |
Two things stand out in the numbers.
?Why isn't scaling linear?
Five threads give 4.3× and ten give 8.2×, where you might expect 5× and 10×. On a machine with identical cores you'd suspect memory bandwidth, the rate at which main memory can feed all the cores together. Here the likelier explanation is the one from section 5.3. The chip has only four performance cores, so five threads can't all get one, and ten threads must use all six efficiency cores, which do less work per unit time. That's a hypothesis and not a result. Testing it means pinning threads to particular cores, which macOS makes awkward. On Linux it's one taskset command away (section 9.1 shows it).
Oversubscription costs almost nothing here. Going from 10 to 40 threads, four times as many runnable threads, changed wall time by about 1%. Time-slicing overhead on modern schedulers is small for CPU-bound work. What oversubscription does hurt is latency, which this measurement doesn't show, because every thread waits behind more others. Chapter 16 has that side.
09Watching the scheduler
9.1Finding scheduling problems
Each question this chapter raised has a tool that answers it on a running machine.
# Are threads waiting for a core? (sections 3 and 4)
vmstat 1                     # 'r' column = run queue depth: threads on a core or waiting for one
perf sched record -- sleep 10   # record scheduler events for 10 s, then:
perf sched latency --sort max   # worst wait in the run queue, per task

# Where did a thread go to sleep, and for how long? (section 3.3)
perf record -e sched:sched_switch -g ./app

# How often is a process switched out? (section 6)
grep ctxt /proc/$PID/status  # voluntary = it blocked; nonvoluntary = it was preempted
perf stat -e context-switches,cpu-migrations ./app   # migrations = moves to another core

# Is the container being throttled? (section 7.1) Check this FIRST in any container
cat /sys/fs/cgroup/cpu.max   # run inside the container: quota and period, in microseconds
cat /sys/fs/cgroup/cpu.stat  | grep -E 'nr_throttled|throttled_usec'

# Which kernel scheduler, and which core? (sections 5.2 and 5.3)
uname -r                     # 6.6 or newer means EEVDF
taskset -c 0-3 ./app         # pin to cores 0-3, then re-measure
If nr_throttled is climbing, stop everything else and fix that. No other measurement in a throttled container means anything.
9.2Rules that hold up
- Look at run queue depth and off-CPU time, not only at the flame graph. The flame graph can't see runnable or blocked threads (section 4.2).
- Check
nr_throttledfirst in any container. A frozen cgroup makes every other number unreliable (section 7.1). - Size thread pools from the container's limit, not the host's core count. More threads spend the quota faster (section 7.1).
- Reuse threads. A pool pays the creation cost once instead of 13.8 µs per request (section 8.1).
- Wake one waiter when one can make progress.
notify_oneovernotify_all(section 7.3). - Pin threads before comparing benchmarks on a machine with performance and efficiency cores (section 5.3).
9.3What you give up
| You get | You pay | When the bill arrives |
|---|---|---|
| Preemption and time slices | No control over when you run | As latency variance nobody can attribute |
| Fair-share scheduling | Fair isn't predictable | When one tenant needs a guarantee |
| Cheap oversubscription for throughput | Latency degrades even when throughput doesn't | At p99, never at the mean |
| cgroup CPU limits | Quota exhaustion freezes you for the rest of the period | As p99 in multiples of 100 ms |
| Mixed performance and efficiency cores, better battery | Threads are no longer interchangeable | As benchmarks that won't reproduce |
9.4Symptom, cause, check
| Symptom | Likely cause | Check |
|---|---|---|
| p99 in multiples of 100 ms | cgroup CPU throttling | cpu.stat nr_throttled |
| Slow requests, low CPU% | Threads blocked on I/O or locks, or the cgroup throttled | Off-CPU analysis, then cpu.stat |
| Latency grows as load grows, CPU near 100% | Oversubscription: more runnable threads than cores | vmstat r column against the core count |
| More threads, same throughput | At the core count already | Count cores; check affinity |
| Latency varies run to run | Threads landing on performance or efficiency cores | Pin with taskset and compare |
| Many wakeups, little work | Thundering herd | notify_all, or epoll without EPOLLEXCLUSIVE |
10Summary
- Most processes are asleep. 715 processes shared 10 cores with only 2 running, and a sleeping process costs almost nothing.
- A process holds the memory and files, and a thread is what runs. Threads in one process share an address space, so you choose between sharing and a failure boundary. The scheduler treats them almost the same.
forkclones a process,execreplaces its program, andwaitpidcollects its exit status. A child that has exited and not been waited for stays as a zombie.- Between creation and exit, a thread is running, runnable or blocked. A woken thread joins the back of the run queue, and only the running state shows up in a CPU profile.
- Runnable time is where latency under load hides. Four threads sharing a core took 34 to 40 ms to do 10 ms of work each.
- The scheduler promises "eventually", nothing more. Timing guarantees have to come from priorities, affinity or a real-time class.
- Linux replaced CFS with EEVDF in 6.6. It adds lag and deadlines, so threads that sleep most of the time get picked sooner.
- A process switch swaps the page table root. That's why it costs more than a thread switch.
- Most of a switch's cost comes after it, as cache and TLB refills charged to the incoming thread.
- A CPU limit is a quota per 100 ms period. Eight threads spent a 50 ms quota in about 6 ms and then froze for 94, so a 10 ms request took about 104 ms. More threads spend the quota faster.
- Creating a thread costs about 127 times a round trip between live ones (13.8 µs against 109 ns), which is the case for pools. Past the core count, extra threads add latency and no throughput: forty threads ran within about 1% of ten on a ten-core machine.
11Build this
Reproduce cgroup throttling on purpose, because recognising its signature once is worth more than reading about it three times.
- Run a CPU-bound loop in a container limited to 0.5 CPU.
- Record per-iteration latency and plot the distribution.
- You should see one stall in every 100 ms period: about 50 ms of running, then about 50 ms frozen, as in section 7.1.
- Now give it 4 threads at the same 0.5 limit. The stalls get longer, close to 90 ms in every period, because four threads drain the 50 ms quota in about 12.5 ms.
Then read cpu.stat and match throttled_usec against the gaps you plotted.
Once you've seen that shape you'll recognise it in a production dashboard in
about five seconds.
12Interview questions
beginnerWhat's the difference between a process and a thread?›
What they share. Threads within a process share an address space, file descriptors and signal handlers; processes share none of that by default. Both are scheduled the same way on Linux: the kernel schedules tasks, its name for anything that can run, and doesn't much care which kind you made.
So the choice is a shared address space or a failure boundary. A crashed thread takes the process with it; a crashed process doesn't.
intermediateYour containerised service has p99 latency at almost exactly 100 ms multiples and uses 30% CPU. What is it?›
cgroup CPU throttling. Limits are enforced as a quota per period, 100 ms by default. Once the quota is spent the container is frozen until the period rolls over, so every stall ends on a period boundary.
Average CPU looks low because the average includes the frozen time. Check
nr_throttled and throttled_usec in cpu.stat. A multi-threaded runtime
makes it worse: eight threads drain a 50 ms budget in about 6 ms of wall time,
and a 10 ms request that arrives in that burst finishes after about 104 ms.
intermediateYou doubled threads from 10 to 20 on a 10-core box. Throughput is unchanged. Is that expected?›
Yes for CPU-bound work. Ten threads already saturate ten cores; the rest just time-slice. A fixed amount of work took 4.40 ms with 10 threads and 4.42 ms with 20, under 1% apart, so the scheduler's overhead is small.
What does change is latency. Each thread now waits behind others, so p99 degrades while throughput holds. If your work is I/O-bound the answer flips, and more threads help until you run out of something else.
deepWhy is a context switch more expensive than the register save suggests?›
Because the expensive part happens after it. The incoming thread finds caches holding another thread's data and, across processes, a TLB that no longer describes its address space. Those refills are charged to your thread's run time, not to the switch.
Crossing processes also swaps the page table root. Meltdown mitigations made this worse by unmapping most kernel pages from the user page table, so on the processors that need it, even a system call now involves page table work that used to be free.
deepScaling to 5 threads gave 4.3x and to 10 gave 8.2x on a 10-core machine. Why not linear?›
On a machine with identical cores you'd suspect memory bandwidth or a shared resource. On a chip with performance and efficiency cores, the likelier cause is that a thread on an efficiency core does less work per unit time, and five threads probably didn't all land on performance cores.
That's a hypothesis, not a result. Pinning threads to core types is awkward on
macOS. On Linux it's one taskset away, and that's the experiment that would
settle it.
13Go deeper
Which thread state is invisible in a CPU flame graph?›
Runnable-but-not-running, and blocked. Neither is executing on a core, so neither appears, and that's where latency under load lives.
Your container is limited to 0.5 CPU and has 8 threads. What happens?›
Eight threads drain the 50 ms quota about eight times faster, so you stall for most of each 100 ms period. More threads makes throttling worse, not better.
Roughly what does creating an OS thread cost compared to using an existing one?›
Around 127×: 13.8 µs to create and join, against 109 ns for a round trip between two live threads.
Why might the same benchmark give different numbers run to run on a modern laptop?›
Mixed core types. Placement on performance versus efficiency cores is the scheduler's choice and it varies. Pin threads before comparing.
Processes, the process API (fork, exec, wait), limited direct execution with the timer interrupt, and scheduling from first-come-first-served up to proportional share and multiprocessors. Free online at ostep.org.
Jonathan Corbet's write-ups on the CFS replacement, and the clearest explanation of lag and virtual deadlines available.
The technique for finding time your threads spend not running. Complements a flame graph exactly where a flame graph is blind.
The Omio post that made this a mainstream concern, with reproductions.
nr_throttled and throttled_usec. Two counters that resolve a whole class
of latency mystery in one cat.
14Related chapters
The page tables and TLB a process switch has to swap and refill. Chapter 04.
The interrupt that lets the kernel take a core back, and the cost of every trip into the kernel. Chapter 07.
cgroups, and the CPU quota behind throttling. Chapter 11.
Priority inversion, futexes, and what happens when a lock holder gets descheduled. Chapter 13.
Thread pools, and the creation-versus-reuse ratio from section 8 worked through. Chapter 15.
Convoys and the latency side of oversubscription that throughput numbers hide. Chapter 16.